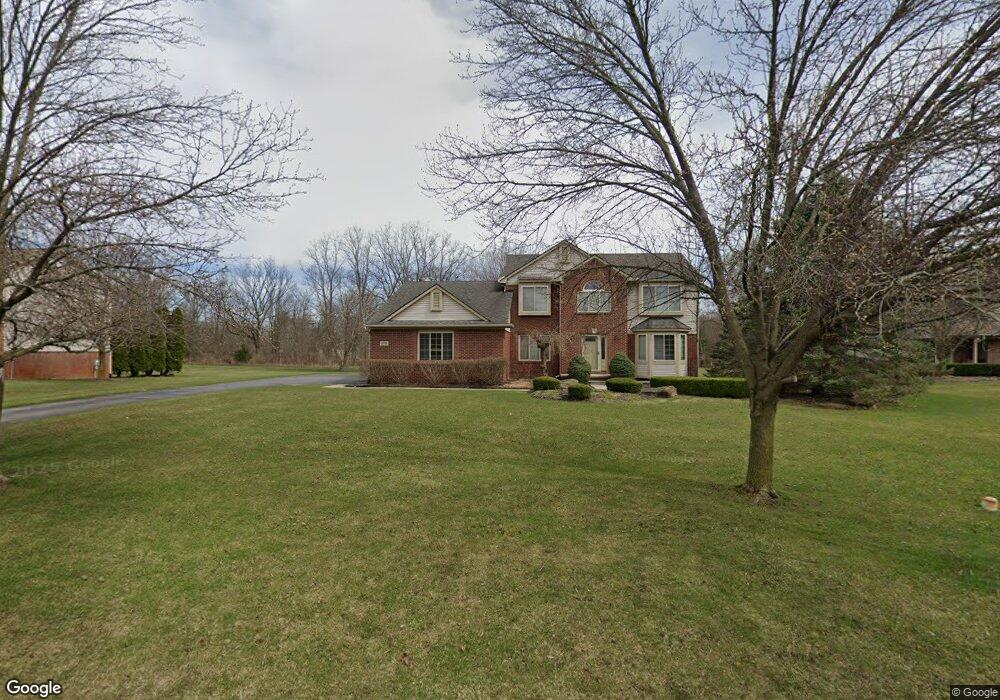
21586 Nathan Ct Unit 13 South Lyon, MI 48178
Estimated Value: $592,000 - $712,000
4
Beds
3
Baths
2,764
Sq Ft
$230/Sq Ft
Est. Value
About This Home
This home is located at 21586 Nathan Ct Unit 13, South Lyon, MI 48178 and is currently estimated at $635,194, approximately $229 per square foot. 21586 Nathan Ct Unit 13 is a home located in Oakland County with nearby schools including Sayre Elementary School, Millennium Middle School, and South Lyon East High School.
Ownership History
Date
Name
Owned For
Owner Type
Purchase Details
Closed on
Dec 16, 2009
Sold by
Crown Pacific Inc
Bought by
Jankowski Anthony J and Jankowski Bridget L
Current Estimated Value
Home Financials for this Owner
Home Financials are based on the most recent Mortgage that was taken out on this home.
Original Mortgage
$263,145
Outstanding Balance
$171,638
Interest Rate
4.9%
Mortgage Type
FHA
Estimated Equity
$463,556
Purchase Details
Closed on
Feb 2, 2001
Sold by
Tri - Mount Canzano Lyon T
Bought by
Luke Timothy R
Home Financials for this Owner
Home Financials are based on the most recent Mortgage that was taken out on this home.
Original Mortgage
$215,900
Interest Rate
7.06%
Purchase Details
Closed on
Feb 1, 2001
Sold by
J A C Development
Bought by
Luke Timothy R
Home Financials for this Owner
Home Financials are based on the most recent Mortgage that was taken out on this home.
Original Mortgage
$215,900
Interest Rate
7.06%
Create a Home Valuation Report for This Property
The Home Valuation Report is an in-depth analysis detailing your home's value as well as a comparison with similar homes in the area
Home Values in the Area
Average Home Value in this Area
Purchase History
| Date | Buyer | Sale Price | Title Company |
|---|---|---|---|
| Jankowski Anthony J | $268,000 | Metropolitan | |
| Crown Pacific Inc | $268,000 | None Available | |
| Luke Timothy R | $272,358 | -- | |
| Luke Timothy R | -- | -- |
Source: Public Records
Mortgage History
| Date | Status | Borrower | Loan Amount |
|---|---|---|---|
| Open | Jankowski Anthony J | $263,145 | |
| Previous Owner | Luke Timothy R | $215,900 |
Source: Public Records
Tax History Compared to Growth
Tax History
| Year | Tax Paid | Tax Assessment Tax Assessment Total Assessment is a certain percentage of the fair market value that is determined by local assessors to be the total taxable value of land and additions on the property. | Land | Improvement |
|---|---|---|---|---|
| 2024 | $3,225 | $247,000 | $0 | $0 |
| 2023 | $3,076 | $224,920 | $0 | $0 |
| 2022 | $4,206 | $198,200 | $0 | $0 |
| 2021 | $3,842 | $194,580 | $0 | $0 |
| 2020 | $2,828 | $183,040 | $0 | $0 |
| 2019 | $3,842 | $180,810 | $0 | $0 |
| 2018 | $3,806 | $178,230 | $0 | $0 |
| 2017 | $3,866 | $175,460 | $0 | $0 |
| 2016 | $3,881 | $165,780 | $0 | $0 |
| 2015 | -- | $152,030 | $0 | $0 |
| 2014 | -- | $129,420 | $0 | $0 |
| 2011 | -- | $110,550 | $0 | $0 |
Source: Public Records
Map
Nearby Homes
- 22150 Donnas Drive St
- 22622 Pine Dr
- 58844 Blackstone Way
- 20886 Hasenclever Dr
- 20859 Hasenclever Dr
- 58574 Blackstone Way
- 21008 Campolina Dr
- The Huntington Plan at Windridge Estates
- The Fullerton Plan at Windridge Estates
- The Sequoia Plan at Windridge Estates
- The Charleston Plan at Windridge Estates
- 22607 Kay St
- 59121 Oasis Center Dr
- 000 Eight Mile W
- 21422 Navarra Dr
- 58581 Navarra Dr
- 58802 Falabella Dr
- 58688 Losino Dr
- 58672 Losino Dr
- 22185 Quail Run Cir Unit 3
- 21580 Nathan Ct
- 21592 Nathan Ct
- 21572 Nathan Ct
- 21598 Nathan Ct Unit 11
- 21595 Nathan Ct
- 21589 Nathan Ct
- 59591 Mary Ln
- 21604 Nathan Ct
- 21566 Nathan Ct
- 60592 Gary Ct Unit 17
- 60603 Mary Ln Unit 1
- 59585 Mary Ln
- 60586 Gary Ct
- 60615 S Lyon Trail
- 21575 Nathan Ct
- 60609 Mary Ln
- 0 Mary Ln
- 60600 Mary Ln
- 21560 Nathan Ct
- 21569 Nathan Ct Unit 26