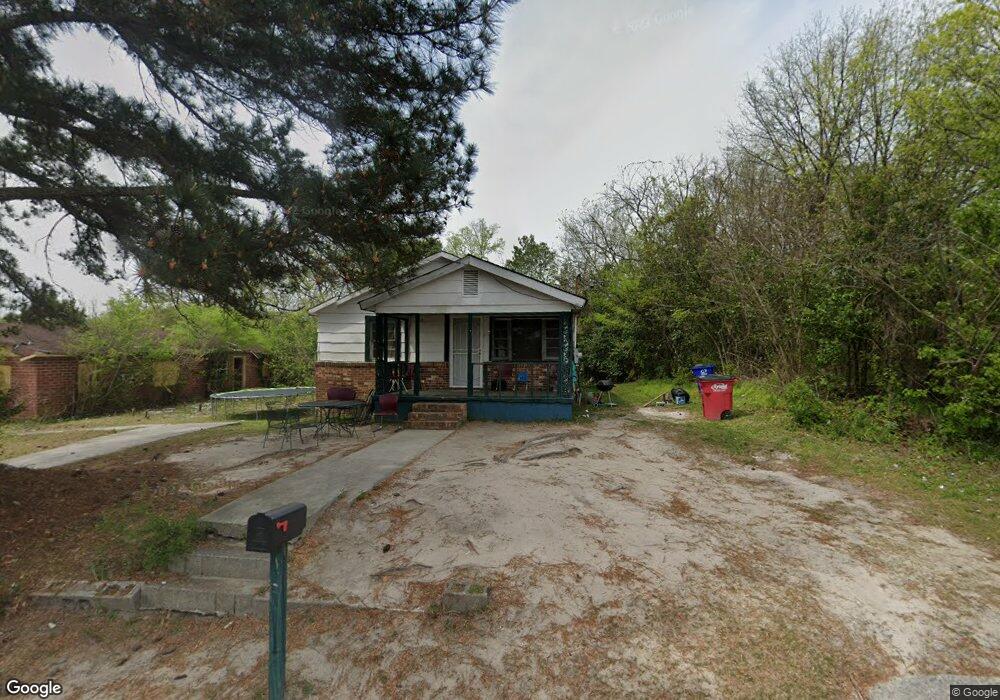
2159 Canton St Macon, GA 31204
Estimated Value: $60,000 - $104,000
2
Beds
1
Bath
1,272
Sq Ft
$60/Sq Ft
Est. Value
About This Home
This home is located at 2159 Canton St, Macon, GA 31204 and is currently estimated at $76,806, approximately $60 per square foot. 2159 Canton St is a home located in Bibb County with nearby schools including Ingram-Pye Elementary School, Southwest High School, and Cirrus Charter Academy.
Ownership History
Date
Name
Owned For
Owner Type
Purchase Details
Closed on
Aug 18, 2011
Sold by
Silver Pines Lp
Bought by
Bentley Calvin
Current Estimated Value
Purchase Details
Closed on
Oct 7, 2008
Sold by
Williams Chandra P
Bought by
Silver Pines Lp
Purchase Details
Closed on
Aug 31, 2007
Sold by
Rbc Mortgage
Bought by
Williams Chandra P
Home Financials for this Owner
Home Financials are based on the most recent Mortgage that was taken out on this home.
Original Mortgage
$15,500
Interest Rate
6.62%
Mortgage Type
Purchase Money Mortgage
Purchase Details
Closed on
Feb 22, 2007
Purchase Details
Closed on
Sep 5, 2006
Purchase Details
Closed on
May 24, 2004
Purchase Details
Closed on
Jun 2, 2003
Purchase Details
Closed on
Jan 7, 2003
Purchase Details
Closed on
Aug 24, 2000
Create a Home Valuation Report for This Property
The Home Valuation Report is an in-depth analysis detailing your home's value as well as a comparison with similar homes in the area
Purchase History
| Date | Buyer | Sale Price | Title Company |
|---|---|---|---|
| Bentley Calvin | $2,500 | None Available | |
| Silver Pines Lp | $18,000 | -- | |
| Williams Chandra P | $8,900 | None Available | |
| -- | $50,900 | -- | |
| Centura Rbc | $50,862 | None Available | |
| Chase Home Finance Llc | $50,862 | None Available | |
| -- | $50,900 | -- | |
| Federal National Mortgage Association | $50,862 | None Avilebel | |
| -- | $55,000 | -- | |
| -- | $19,900 | -- | |
| -- | $41,100 | -- | |
| -- | $22,500 | -- |
Source: Public Records
Mortgage History
| Date | Status | Borrower | Loan Amount |
|---|---|---|---|
| Previous Owner | Williams Chandra P | $15,500 |
Source: Public Records
Tax History
| Year | Tax Paid | Tax Assessment Tax Assessment Total Assessment is a certain percentage of the fair market value that is determined by local assessors to be the total taxable value of land and additions on the property. | Land | Improvement |
|---|---|---|---|---|
| 2025 | $449 | $18,255 | $2,565 | $15,690 |
| 2024 | $464 | $18,255 | $2,565 | $15,690 |
| 2023 | $343 | $13,522 | $1,900 | $11,622 |
| 2022 | $404 | $11,658 | $3,396 | $8,262 |
| 2021 | $443 | $11,658 | $3,396 | $8,262 |
| 2020 | $453 | $11,658 | $3,396 | $8,262 |
| 2019 | $456 | $11,658 | $3,396 | $8,262 |
| 2018 | $879 | $11,658 | $3,396 | $8,262 |
| 2017 | $437 | $11,658 | $3,396 | $8,262 |
| 2016 | $403 | $11,659 | $3,396 | $8,262 |
| 2015 | $571 | $11,659 | $3,396 | $8,262 |
| 2014 | $657 | $11,659 | $3,396 | $8,262 |
Source: Public Records
Map
Nearby Homes
Your Personal Tour Guide
Ask me questions while you tour the home.