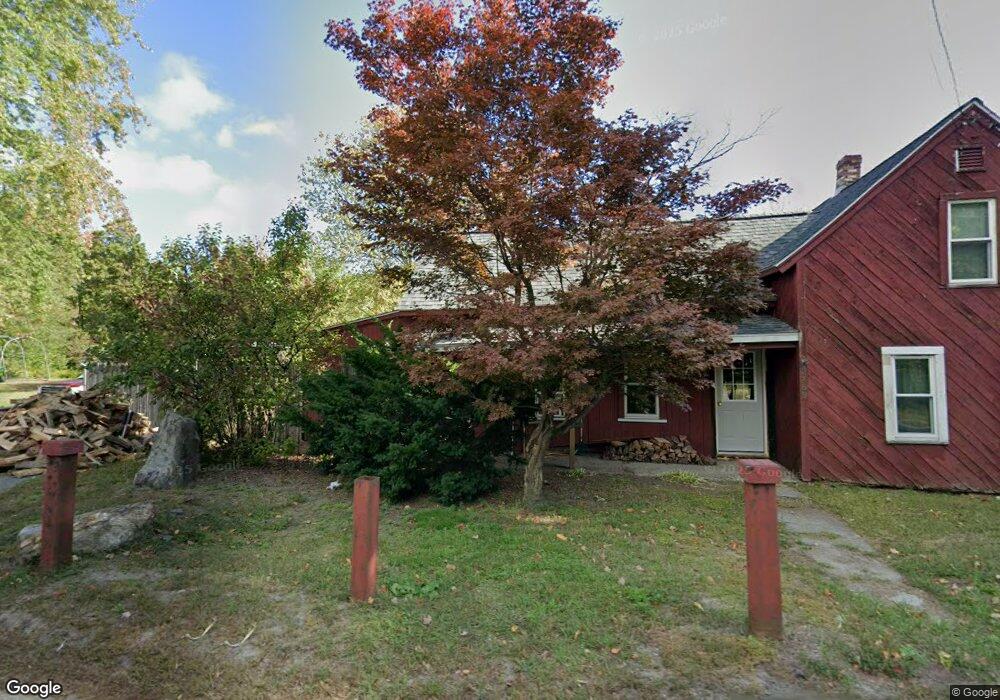
2159 Main St Lancaster, MA 01523
Estimated Value: $372,000 - $452,647
2
Beds
1
Bath
1,476
Sq Ft
$285/Sq Ft
Est. Value
About This Home
This home is located at 2159 Main St, Lancaster, MA 01523 and is currently estimated at $420,912, approximately $285 per square foot. 2159 Main St is a home located in Worcester County with nearby schools including Mary Rowlandson Elementary School, Luther Burbank Middle School, and Nashoba Regional High School.
Ownership History
Date
Name
Owned For
Owner Type
Purchase Details
Closed on
Jun 11, 2004
Sold by
Smith Kevin C and Smith Martha Carter
Bought by
Smith Kevin C and Smith Martha Carter
Current Estimated Value
Home Financials for this Owner
Home Financials are based on the most recent Mortgage that was taken out on this home.
Original Mortgage
$180,000
Outstanding Balance
$87,932
Interest Rate
5.99%
Mortgage Type
Purchase Money Mortgage
Estimated Equity
$332,980
Purchase Details
Closed on
Sep 4, 2001
Sold by
Evergates James C and Evergates Mary L
Bought by
Smith Kevin C and Carter-Smith Martha
Home Financials for this Owner
Home Financials are based on the most recent Mortgage that was taken out on this home.
Original Mortgage
$121,500
Interest Rate
7.06%
Mortgage Type
Purchase Money Mortgage
Create a Home Valuation Report for This Property
The Home Valuation Report is an in-depth analysis detailing your home's value as well as a comparison with similar homes in the area
Home Values in the Area
Average Home Value in this Area
Purchase History
| Date | Buyer | Sale Price | Title Company |
|---|---|---|---|
| Smith Kevin C | -- | -- | |
| Smith Kevin C | $135,000 | -- |
Source: Public Records
Mortgage History
| Date | Status | Borrower | Loan Amount |
|---|---|---|---|
| Open | Smith Kevin C | $180,000 | |
| Previous Owner | Smith Kevin C | $41,000 | |
| Previous Owner | Smith Kevin C | $133,500 | |
| Previous Owner | Smith Kevin C | $121,500 |
Source: Public Records
Tax History
| Year | Tax Paid | Tax Assessment Tax Assessment Total Assessment is a certain percentage of the fair market value that is determined by local assessors to be the total taxable value of land and additions on the property. | Land | Improvement |
|---|---|---|---|---|
| 2025 | $4,769 | $295,100 | $130,200 | $164,900 |
| 2024 | $5,077 | $290,800 | $120,200 | $170,600 |
| 2023 | $0 | $263,800 | $110,200 | $153,600 |
| 2022 | $4,452 | $228,900 | $100,400 | $128,500 |
| 2021 | $4,314 | $215,900 | $100,400 | $115,500 |
| 2020 | $4,282 | $215,700 | $100,400 | $115,300 |
| 2019 | $4,130 | $209,100 | $100,400 | $108,700 |
| 2018 | $4,038 | $202,100 | $100,400 | $101,700 |
| 2016 | $3,758 | $192,200 | $99,400 | $92,800 |
| 2015 | $3,598 | $191,800 | $99,400 | $92,400 |
| 2014 | $3,513 | $185,800 | $99,400 | $86,400 |
Source: Public Records
Map
Nearby Homes
- 2290 Main St
- 303 Ponakin Rd
- 2038-1 Laurel Hill Ln
- 2038 Laurel Hill Ln Unit LOT 18
- 1497 Lunenburg Rd
- 35 Mcgovern Blvd
- 0 Main St
- 193 Bayberry Hill Ln
- 18 Highfield Dr
- 437 Johnny Appleseed Ln
- 121 &125 Flanagan Hill Rd
- 851 Lancaster St
- 2 Turtle Ln Unit 2
- 144 Seven Bridge Rd
- 7 Lawson Ave
- 675 Willard St
- 23 Lantern Ln
- 99 Cortland Cir
- 372 Litchfield St
- 12 Meditation Ln Unit 12
Your Personal Tour Guide
Ask me questions while you tour the home.