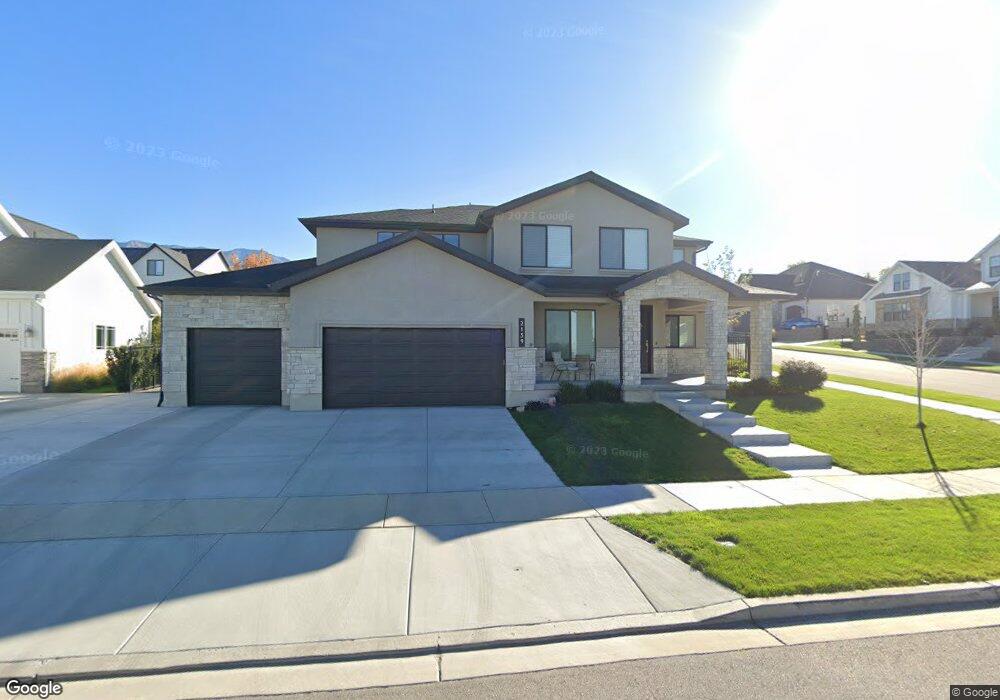
2159 S 60 W Orem, UT 84058
Lakeview NeighborhoodEstimated Value: $1,035,000 - $1,168,089
5
Beds
3
Baths
3,465
Sq Ft
$324/Sq Ft
Est. Value
About This Home
This home is located at 2159 S 60 W, Orem, UT 84058 and is currently estimated at $1,123,696, approximately $324 per square foot. 2159 S 60 W is a home with nearby schools including Cherry Hill Elementary School, Lakeridge Jr High School, and Mountain View High School.
Ownership History
Date
Name
Owned For
Owner Type
Purchase Details
Closed on
Sep 2, 2019
Sold by
Patterson Derek and Patterson Mindy
Bought by
Patterson Derek and Patterson Mindy
Current Estimated Value
Home Financials for this Owner
Home Financials are based on the most recent Mortgage that was taken out on this home.
Original Mortgage
$483,700
Outstanding Balance
$424,549
Interest Rate
3.7%
Estimated Equity
$699,147
Purchase Details
Closed on
Jan 22, 2019
Sold by
Oldham Mark and Patterson Derek Arthur
Bought by
Patterson Derek and Patterson Mindy
Home Financials for this Owner
Home Financials are based on the most recent Mortgage that was taken out on this home.
Original Mortgage
$475,000
Interest Rate
4.5%
Mortgage Type
New Conventional
Purchase Details
Closed on
May 30, 2017
Sold by
Oldham Mark and Patterson Mindy
Bought by
Oldham Mark and Patterson Derek Arthur
Purchase Details
Closed on
May 26, 2017
Sold by
Legacy Ridge Llc
Bought by
Oldham Mark and Peterson Mindy
Create a Home Valuation Report for This Property
The Home Valuation Report is an in-depth analysis detailing your home's value as well as a comparison with similar homes in the area
Home Values in the Area
Average Home Value in this Area
Purchase History
| Date | Buyer | Sale Price | Title Company |
|---|---|---|---|
| Patterson Derek | -- | First Amer Union Heights Ctr | |
| Patterson Derek | -- | First American Title | |
| Oldham Mark | -- | Access Title Co | |
| Oldham Mark | -- | Access Title Co |
Source: Public Records
Mortgage History
| Date | Status | Borrower | Loan Amount |
|---|---|---|---|
| Open | Patterson Derek | $483,700 | |
| Previous Owner | Patterson Derek | $475,000 |
Source: Public Records
Tax History
| Year | Tax Paid | Tax Assessment Tax Assessment Total Assessment is a certain percentage of the fair market value that is determined by local assessors to be the total taxable value of land and additions on the property. | Land | Improvement |
|---|---|---|---|---|
| 2025 | $4,060 | $529,870 | -- | -- |
| 2024 | $4,060 | $496,485 | $0 | $0 |
| 2023 | $3,833 | $503,745 | $0 | $0 |
| 2022 | $3,789 | $482,405 | $0 | $0 |
| 2021 | $3,377 | $651,300 | $217,200 | $434,100 |
| 2020 | $3,178 | $602,300 | $188,900 | $413,400 |
| 2019 | $2,671 | $526,500 | $188,900 | $337,600 |
| 2018 | $1,824 | $188,900 | $188,900 | $0 |
| 2017 | $1,761 | $177,600 | $0 | $0 |
| 2016 | $1,909 | $177,600 | $0 | $0 |
Source: Public Records
Map
Nearby Homes
Your Personal Tour Guide
Ask me questions while you tour the home.