Estimated Value: $348,000 - $417,000
4
Beds
1
Bath
1,354
Sq Ft
$282/Sq Ft
Est. Value
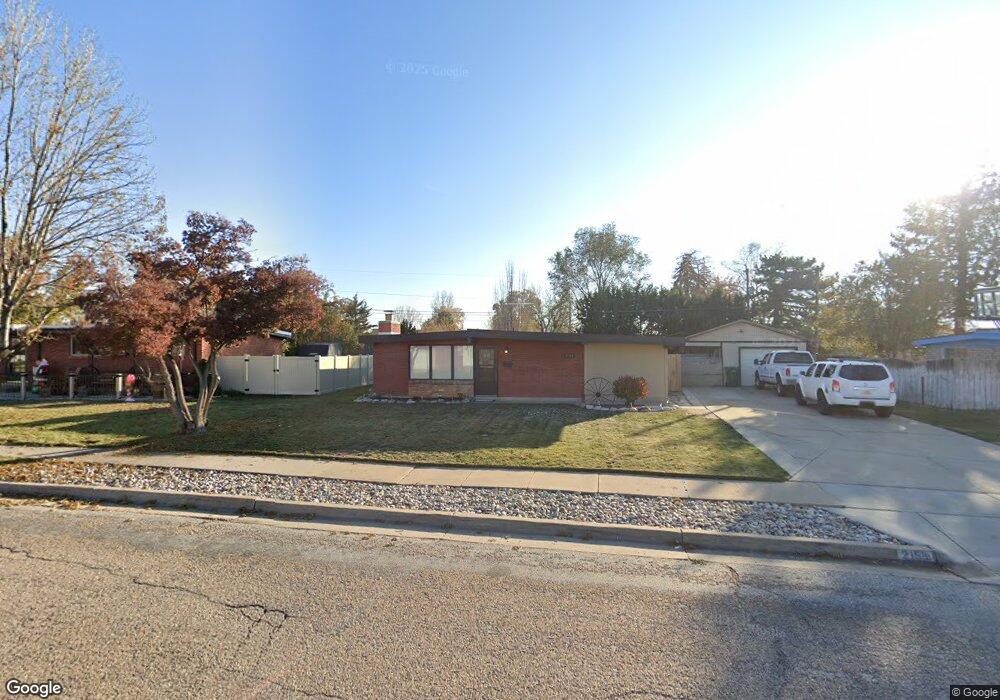
About This Home
This home is located at 2159 W 5075 S, Roy, UT 84067 and is currently estimated at $382,341, approximately $282 per square foot. 2159 W 5075 S is a home located in Weber County with nearby schools including Lakeview Elementary School, Roy Junior High School, and Roy High School.
Ownership History
Date
Name
Owned For
Owner Type
Purchase Details
Closed on
Feb 12, 2021
Sold by
Bowers Curtis
Bought by
Bowers Curtis
Current Estimated Value
Home Financials for this Owner
Home Financials are based on the most recent Mortgage that was taken out on this home.
Original Mortgage
$170,000
Outstanding Balance
$151,915
Interest Rate
2.65%
Mortgage Type
New Conventional
Estimated Equity
$230,426
Purchase Details
Closed on
Feb 14, 2020
Sold by
Bowers Curtis and Bowers Melissa
Bought by
Bowers Curtis
Home Financials for this Owner
Home Financials are based on the most recent Mortgage that was taken out on this home.
Original Mortgage
$170,000
Interest Rate
3.6%
Mortgage Type
New Conventional
Purchase Details
Closed on
Apr 23, 2007
Sold by
Nicholls Gordon H and Nicholls Anna M
Bought by
Bowers Curtis
Create a Home Valuation Report for This Property
The Home Valuation Report is an in-depth analysis detailing your home's value as well as a comparison with similar homes in the area
Home Values in the Area
Average Home Value in this Area
Purchase History
| Date | Buyer | Sale Price | Title Company |
|---|---|---|---|
| Bowers Curtis | -- | Silver Leaf Title Ins Agenc | |
| Bowers Curtis | -- | Silver Leaf Title Ins Agcy | |
| Bowers Curtis | -- | 1St National Title North Sal |
Source: Public Records
Mortgage History
| Date | Status | Borrower | Loan Amount |
|---|---|---|---|
| Open | Bowers Curtis | $170,000 | |
| Closed | Bowers Curtis | $170,000 |
Source: Public Records
Tax History Compared to Growth
Tax History
| Year | Tax Paid | Tax Assessment Tax Assessment Total Assessment is a certain percentage of the fair market value that is determined by local assessors to be the total taxable value of land and additions on the property. | Land | Improvement |
|---|---|---|---|---|
| 2025 | $2,153 | $330,648 | $125,091 | $205,557 |
| 2024 | $2,056 | $174,348 | $68,800 | $105,548 |
| 2023 | $1,960 | $166,100 | $65,252 | $100,848 |
| 2022 | $2,289 | $204,050 | $59,469 | $144,581 |
| 2021 | $1,721 | $248,000 | $72,234 | $175,766 |
| 2020 | $1,616 | $214,001 | $72,234 | $141,767 |
| 2019 | $1,579 | $197,000 | $41,917 | $155,083 |
| 2018 | $1,435 | $167,000 | $38,754 | $128,246 |
| 2017 | $1,289 | $139,000 | $38,754 | $100,246 |
| 2016 | $1,209 | $69,656 | $19,564 | $50,092 |
| 2015 | $1,101 | $64,417 | $19,564 | $44,853 |
| 2014 | $1,100 | $63,758 | $16,687 | $47,071 |
Source: Public Records
Map
Nearby Homes