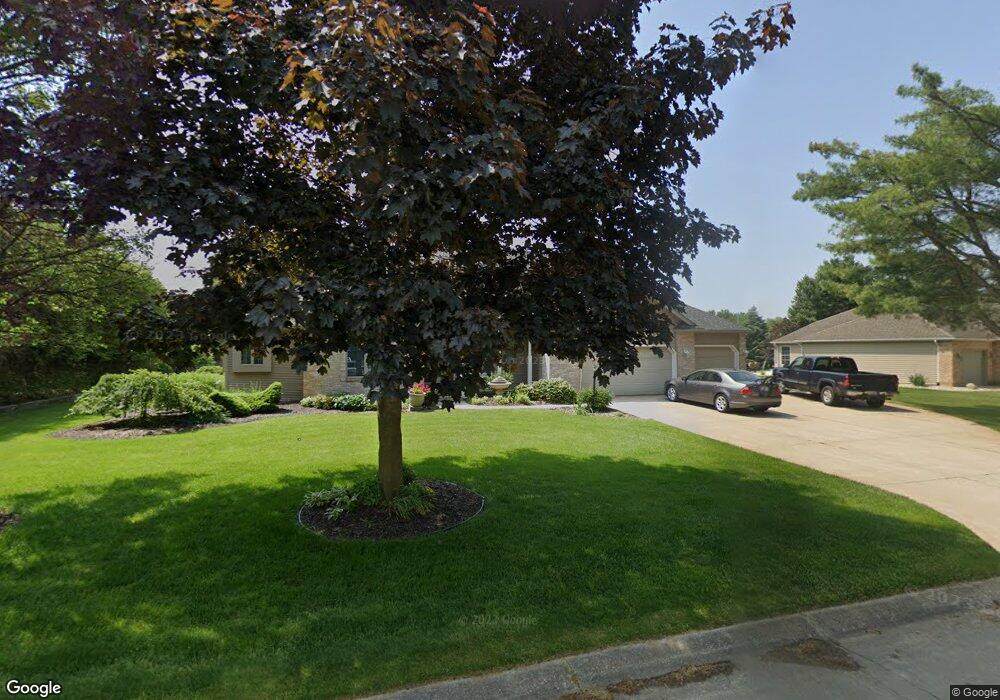
21596 Durham Way Bristol, IN 46507
Pheasant Ridge NeighborhoodEstimated Value: $424,000 - $485,000
3
Beds
4
Baths
1,955
Sq Ft
$231/Sq Ft
Est. Value
About This Home
This home is located at 21596 Durham Way, Bristol, IN 46507 and is currently estimated at $451,861, approximately $231 per square foot. 21596 Durham Way is a home located in Elkhart County with nearby schools including Eastwood Elementary School, Pierre Moran Middle School, and Elkhart High School's Freshman Division.
Ownership History
Date
Name
Owned For
Owner Type
Purchase Details
Closed on
Nov 15, 2011
Sold by
Southern John A and Southern Catherine E
Bought by
Southern John A and Southern Catherine E
Current Estimated Value
Home Financials for this Owner
Home Financials are based on the most recent Mortgage that was taken out on this home.
Original Mortgage
$169,200
Outstanding Balance
$67,601
Interest Rate
4.12%
Mortgage Type
New Conventional
Estimated Equity
$384,260
Purchase Details
Closed on
Nov 23, 2010
Sold by
Southern John A and Southern Catherine E
Bought by
John A Southern Jr & Catherine E Souther
Purchase Details
Closed on
Feb 10, 2006
Sold by
Brown Mark A and Brown Amy S
Bought by
Southern John A and Southern Catherine E
Home Financials for this Owner
Home Financials are based on the most recent Mortgage that was taken out on this home.
Original Mortgage
$181,000
Interest Rate
6.3%
Mortgage Type
Fannie Mae Freddie Mac
Create a Home Valuation Report for This Property
The Home Valuation Report is an in-depth analysis detailing your home's value as well as a comparison with similar homes in the area
Home Values in the Area
Average Home Value in this Area
Purchase History
| Date | Buyer | Sale Price | Title Company |
|---|---|---|---|
| Southern John A | -- | Metropolitan Title | |
| Southern John A | -- | Metropolitan Title | |
| John A Southern Jr & Catherine E Souther | -- | None Available | |
| Southern John A | -- | Lawyers Title |
Source: Public Records
Mortgage History
| Date | Status | Borrower | Loan Amount |
|---|---|---|---|
| Open | Southern John A | $169,200 | |
| Closed | Southern John A | $181,000 |
Source: Public Records
Tax History Compared to Growth
Tax History
| Year | Tax Paid | Tax Assessment Tax Assessment Total Assessment is a certain percentage of the fair market value that is determined by local assessors to be the total taxable value of land and additions on the property. | Land | Improvement |
|---|---|---|---|---|
| 2024 | $2,596 | $379,500 | $30,000 | $349,500 |
| 2022 | $2,596 | $312,600 | $30,000 | $282,600 |
| 2021 | $2,413 | $288,400 | $30,000 | $258,400 |
| 2020 | $2,660 | $286,100 | $30,000 | $256,100 |
| 2019 | $2,464 | $269,600 | $30,000 | $239,600 |
| 2018 | $2,581 | $269,600 | $30,000 | $239,600 |
| 2017 | $2,691 | $269,500 | $30,000 | $239,500 |
| 2016 | $2,529 | $259,400 | $30,000 | $229,400 |
| 2014 | $2,586 | $254,600 | $30,000 | $224,600 |
| 2013 | $2,714 | $254,600 | $30,000 | $224,600 |
Source: Public Records
Map
Nearby Homes
- 21680 Coulteri Ct
- 21475 Cheri Ln
- 21242 Hallton Dr
- 53086 Pine Brook Dr
- 53284 Winfield Ct
- 2548 Timberstone Dr
- 4034 Timber Ct
- 2554 Timberstone Dr
- 2005 Timberstone Dr E
- 3916 Timber Lake Ct
- 20870 N River Ridge Dr
- 2521 Timberstone Dr E
- 21835 State Road 120
- 22722 Fair Oaks Ct
- 54454 Heron Cove Ln
- 20484 County Road 8
- 22266 Heron Cove Ln
- 22252 Heron Cove Ln
- 20442 Longboat Ct
- 52395 County Road 15
- 21626 Durham Way
- 21560 Durham Way
- 21601 Durham Way
- 21585 Durham Way
- 53490 Baywater Place
- 21530 Durham Way
- 53464 Baywater Place
- 0 Durham Way Unit 509794
- TBD Durham Way Unit 66
- 21631 Durham Way
- 21670 Durham Way
- 21557 Durham Way
- 53520 Baywater Place
- 21511 Cheri Ln
- 21520 Cheri Ln
- 21504 Durham Way
- 21529 Durham Way Unit 66
- 21529 Durham Way
- 53560 Baywater Place
- 21674 Coulteri Ct