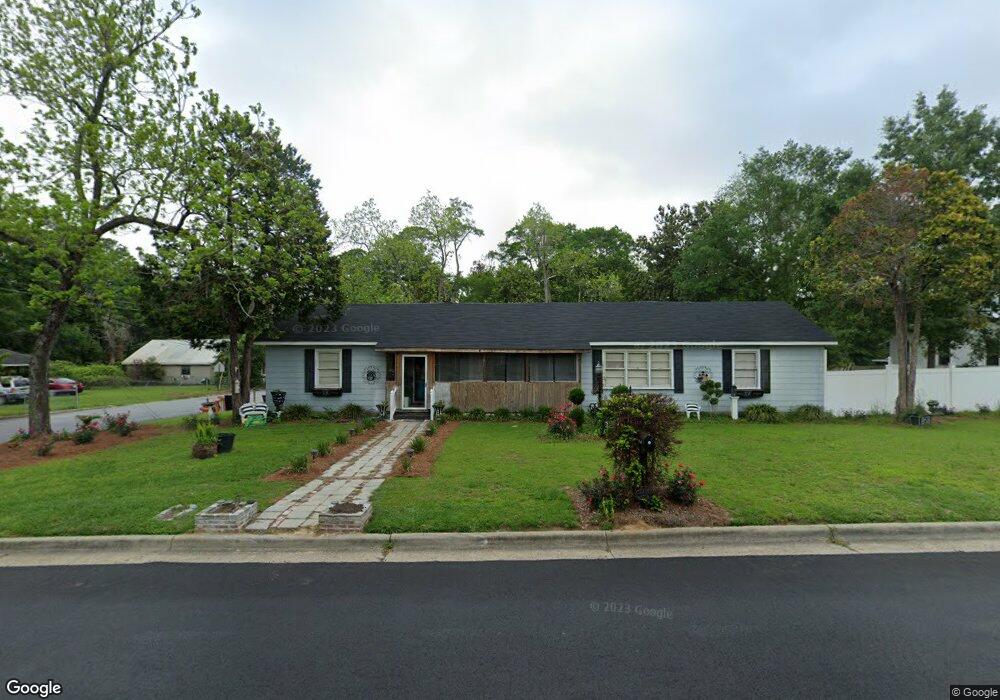
216 4th Ave SW Moultrie, GA 31768
Estimated Value: $115,000 - $205,000
--
Bed
2
Baths
2,073
Sq Ft
$79/Sq Ft
Est. Value
About This Home
This home is located at 216 4th Ave SW, Moultrie, GA 31768 and is currently estimated at $163,686, approximately $78 per square foot. 216 4th Ave SW is a home located in Colquitt County with nearby schools including Stringfellow Elementary School, Willie J. Williams Middle School, and C.A. Gray Junior High School.
Ownership History
Date
Name
Owned For
Owner Type
Purchase Details
Closed on
Jan 4, 2006
Sold by
Otto Michael
Bought by
Cook Alfonzo
Current Estimated Value
Home Financials for this Owner
Home Financials are based on the most recent Mortgage that was taken out on this home.
Original Mortgage
$77,250
Outstanding Balance
$43,042
Interest Rate
6.22%
Mortgage Type
New Conventional
Estimated Equity
$120,644
Purchase Details
Closed on
Dec 13, 2004
Sold by
Green Wilmer
Bought by
Otto Michael
Purchase Details
Closed on
Mar 27, 2000
Sold by
Bradley Teressa Mae G
Bought by
Green Wilmer
Purchase Details
Closed on
Jan 27, 1999
Bought by
Bradley Teressa Mae G
Create a Home Valuation Report for This Property
The Home Valuation Report is an in-depth analysis detailing your home's value as well as a comparison with similar homes in the area
Home Values in the Area
Average Home Value in this Area
Purchase History
| Date | Buyer | Sale Price | Title Company |
|---|---|---|---|
| Cook Alfonzo | $77,250 | -- | |
| Otto Michael | $57,000 | -- | |
| Green Wilmer | $45,000 | -- | |
| Bradley Teressa Mae G | -- | -- |
Source: Public Records
Mortgage History
| Date | Status | Borrower | Loan Amount |
|---|---|---|---|
| Open | Cook Alfonzo | $77,250 |
Source: Public Records
Tax History Compared to Growth
Tax History
| Year | Tax Paid | Tax Assessment Tax Assessment Total Assessment is a certain percentage of the fair market value that is determined by local assessors to be the total taxable value of land and additions on the property. | Land | Improvement |
|---|---|---|---|---|
| 2024 | $1,183 | $50,299 | $2,286 | $48,013 |
| 2023 | $1,474 | $39,808 | $2,286 | $37,522 |
| 2022 | $1,155 | $36,017 | $2,286 | $33,731 |
| 2021 | $1,130 | $34,846 | $2,286 | $32,560 |
| 2020 | $1,091 | $33,163 | $2,286 | $30,877 |
| 2019 | $1,142 | $30,919 | $2,286 | $28,633 |
| 2018 | $1,235 | $30,919 | $2,286 | $28,633 |
| 2017 | $1,130 | $30,919 | $2,286 | $28,633 |
| 2016 | $1,181 | $30,919 | $2,286 | $28,633 |
| 2015 | $1,184 | $30,919 | $2,286 | $28,633 |
| 2014 | $1,212 | $30,919 | $2,286 | $28,633 |
| 2013 | -- | $30,918 | $2,285 | $28,633 |
Source: Public Records
Map
Nearby Homes
- 310 1st Ave SW
- 221 6th St SW
- 118 5th St SW
- 00 1st Ave SW
- 610 4th Ave SW
- 209 7th Ave SW
- 704 3rd St SW
- 600 1st St SE
- 618 2nd Ave SW
- 515 8th St SW
- 610 1st Ave NW
- 614 2nd Ave NW
- 902 2nd St SE
- 407 1st Ave SE
- 515 5th Ave SE Unit 4
- 521 5th Ave SE Unit 4
- 521 5th Ave NW
- 503 2nd St NW
- 316 5th Ave NW
- 408 9th St NW