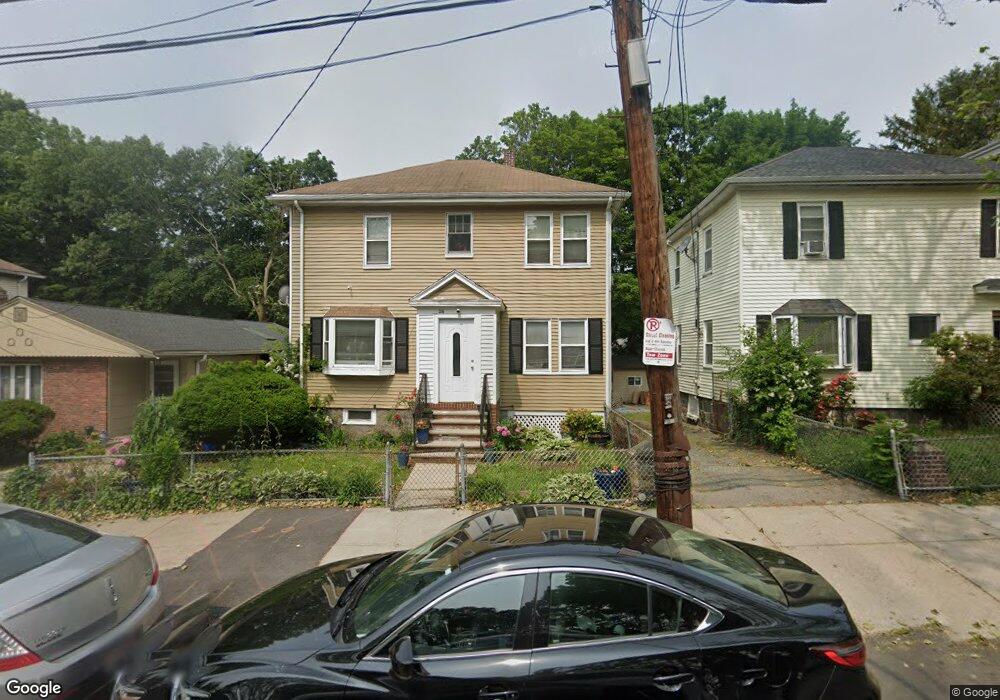
216 Almont St Mattapan, MA 02126
Southern Mattapan NeighborhoodEstimated Value: $533,000 - $661,000
3
Beds
2
Baths
1,612
Sq Ft
$367/Sq Ft
Est. Value
About This Home
This home is located at 216 Almont St, Mattapan, MA 02126 and is currently estimated at $591,993, approximately $367 per square foot. 216 Almont St is a home located in Suffolk County with nearby schools including KIPP Academy Boston Charter School and Berea Seventh-day Adventist Academy.
Ownership History
Date
Name
Owned For
Owner Type
Purchase Details
Closed on
Jul 6, 1988
Sold by
Abdulkerim Esmael
Bought by
Morson Horace B
Current Estimated Value
Home Financials for this Owner
Home Financials are based on the most recent Mortgage that was taken out on this home.
Original Mortgage
$114,300
Interest Rate
10.54%
Mortgage Type
Purchase Money Mortgage
Create a Home Valuation Report for This Property
The Home Valuation Report is an in-depth analysis detailing your home's value as well as a comparison with similar homes in the area
Home Values in the Area
Average Home Value in this Area
Purchase History
| Date | Buyer | Sale Price | Title Company |
|---|---|---|---|
| Morson Horace B | $127,000 | -- |
Source: Public Records
Mortgage History
| Date | Status | Borrower | Loan Amount |
|---|---|---|---|
| Open | Morson Horace B | $152,000 | |
| Closed | Morson Horace B | $114,300 | |
| Previous Owner | Morson Horace B | $30,000 |
Source: Public Records
Tax History Compared to Growth
Tax History
| Year | Tax Paid | Tax Assessment Tax Assessment Total Assessment is a certain percentage of the fair market value that is determined by local assessors to be the total taxable value of land and additions on the property. | Land | Improvement |
|---|---|---|---|---|
| 2025 | $4,347 | $375,400 | $117,100 | $258,300 |
| 2024 | $3,899 | $357,700 | $125,400 | $232,300 |
| 2023 | $3,658 | $340,600 | $119,400 | $221,200 |
| 2022 | $3,432 | $315,400 | $110,600 | $204,800 |
| 2021 | $3,029 | $283,900 | $105,300 | $178,600 |
| 2020 | $2,242 | $212,300 | $93,900 | $118,400 |
| 2019 | $2,143 | $203,300 | $75,000 | $128,300 |
| 2018 | $1,991 | $190,000 | $75,000 | $115,000 |
| 2017 | $2,610 | $246,500 | $75,000 | $171,500 |
| 2016 | $2,465 | $224,100 | $75,000 | $149,100 |
| 2015 | $2,481 | $204,900 | $81,700 | $123,200 |
| 2014 | $2,364 | $187,900 | $81,700 | $106,200 |
Source: Public Records
Map
Nearby Homes
- 10 Itasca St
- 49 Fottler Rd
- 14-14R Kennebec St
- 58 Mattapan St
- 4 Gilmer St
- 116 Almont St
- 60 and 64 Monterey Ave
- 45 1st Ave Unit 111
- 100 Itasca St
- 20 Monterey Ave
- 710 Walk Hill St
- 30-32 Westmore Rd
- 12 Hiawatha Rd
- 23 Fessenden St
- 25 Fessenden St
- 567B Norfolk St
- 10 Hosmer St
- 6 Deering Rd
- 72 Livermore St
- 17 Greendale Rd Unit 2F
- 212 Almont St
- 220 Almont St Unit C
- 220 Almont St Unit B
- 220 Almont St Unit A
- 220 Almont St
- 208 Almont St
- 224 Almont St Unit B
- 224 Almont St
- 27 Wabash St
- 31 Wabash St
- 23 Wabash St
- 204 Almont St
- 228 Almont St Unit 1D
- 228 Almont St
- 35 Wabash St
- 19 Wabash St
- 23 Prairie St
- 205 Almont St
- 200 Almont St
- 230 Almont St