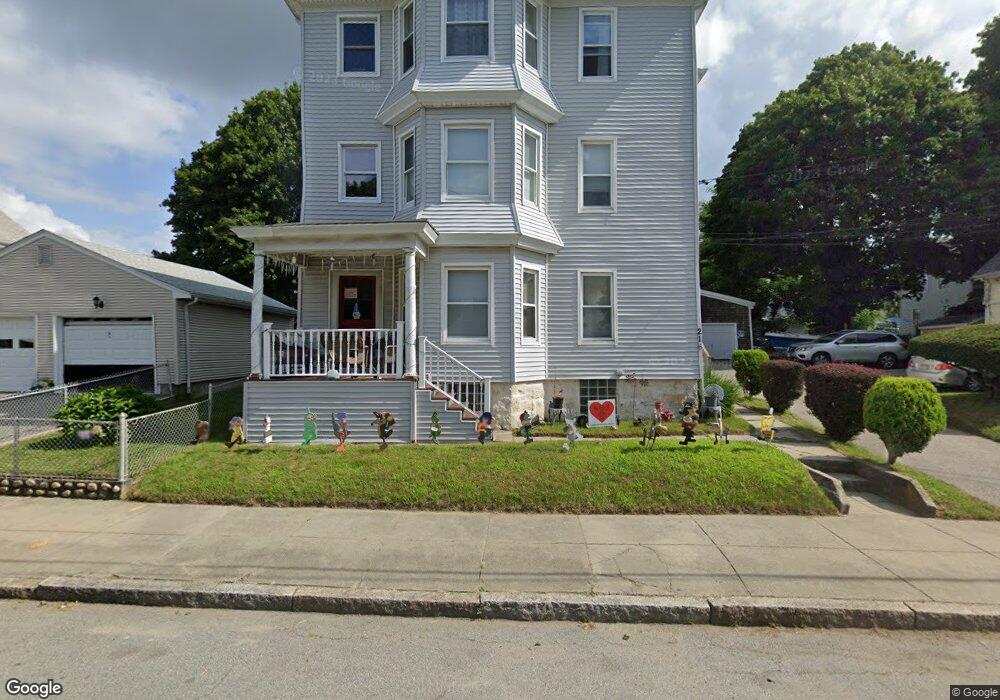
216 Anthony St Fall River, MA 02721
Maplewood NeighborhoodEstimated Value: $540,889 - $721,000
9
Beds
3
Baths
3,433
Sq Ft
$190/Sq Ft
Est. Value
About This Home
This home is located at 216 Anthony St, Fall River, MA 02721 and is currently estimated at $652,222, approximately $189 per square foot. 216 Anthony St is a home located in Bristol County with nearby schools including Letourneau Elementary School, Matthew J. Kuss Middle School, and B M C Durfee High School.
Ownership History
Date
Name
Owned For
Owner Type
Purchase Details
Closed on
Mar 19, 2019
Sold by
Vezina Pauline M
Bought by
Pauline M Vezina Ret 2019
Current Estimated Value
Purchase Details
Closed on
Oct 9, 1996
Sold by
Costa Manuel
Bought by
Vezina Donald D and Vezina Pauline M
Home Financials for this Owner
Home Financials are based on the most recent Mortgage that was taken out on this home.
Original Mortgage
$112,000
Interest Rate
8.06%
Mortgage Type
Purchase Money Mortgage
Create a Home Valuation Report for This Property
The Home Valuation Report is an in-depth analysis detailing your home's value as well as a comparison with similar homes in the area
Home Values in the Area
Average Home Value in this Area
Purchase History
| Date | Buyer | Sale Price | Title Company |
|---|---|---|---|
| Pauline M Vezina Ret 2019 | -- | -- | |
| Vezina Donald D | $140,000 | -- |
Source: Public Records
Mortgage History
| Date | Status | Borrower | Loan Amount |
|---|---|---|---|
| Previous Owner | Vezina Donald D | $125,000 | |
| Previous Owner | Vezina Donald D | $112,000 |
Source: Public Records
Tax History
| Year | Tax Paid | Tax Assessment Tax Assessment Total Assessment is a certain percentage of the fair market value that is determined by local assessors to be the total taxable value of land and additions on the property. | Land | Improvement |
|---|---|---|---|---|
| 2025 | $6,172 | $539,000 | $128,400 | $410,600 |
| 2024 | $5,917 | $515,000 | $123,500 | $391,500 |
| 2023 | $5,450 | $444,200 | $105,900 | $338,300 |
| 2022 | $4,840 | $383,500 | $96,300 | $287,200 |
| 2021 | $4,563 | $329,900 | $89,100 | $240,800 |
| 2020 | $4,107 | $284,200 | $85,300 | $198,900 |
| 2019 | $3,543 | $243,000 | $81,200 | $161,800 |
| 2018 | $3,313 | $226,600 | $79,700 | $146,900 |
| 2017 | $3,195 | $228,200 | $81,300 | $146,900 |
| 2016 | $3,113 | $228,400 | $84,700 | $143,700 |
| 2015 | $2,948 | $225,400 | $81,500 | $143,900 |
| 2014 | $3,041 | $241,700 | $85,800 | $155,900 |
Source: Public Records
Map
Nearby Homes
- 93 Lawton St
- 125 Carl St
- 478 Tucker St
- 539 Aetna St
- 143 Meeson St
- 59 Wayne St
- 250 Laurel St
- 186 Spencer St
- 59 Denver St
- 495 Chicago St
- 119 Pebble St
- 311 S Oxford St
- 340 Vale St
- 231 Lapham St
- 545 Brayton Ave
- 1350 Rodman St
- 21 Boyden St
- 4 Bronson St
- 0 Stafford Rd Unit 1393774
- 0 Stafford Rd Unit 73431501
Your Personal Tour Guide
Ask me questions while you tour the home.