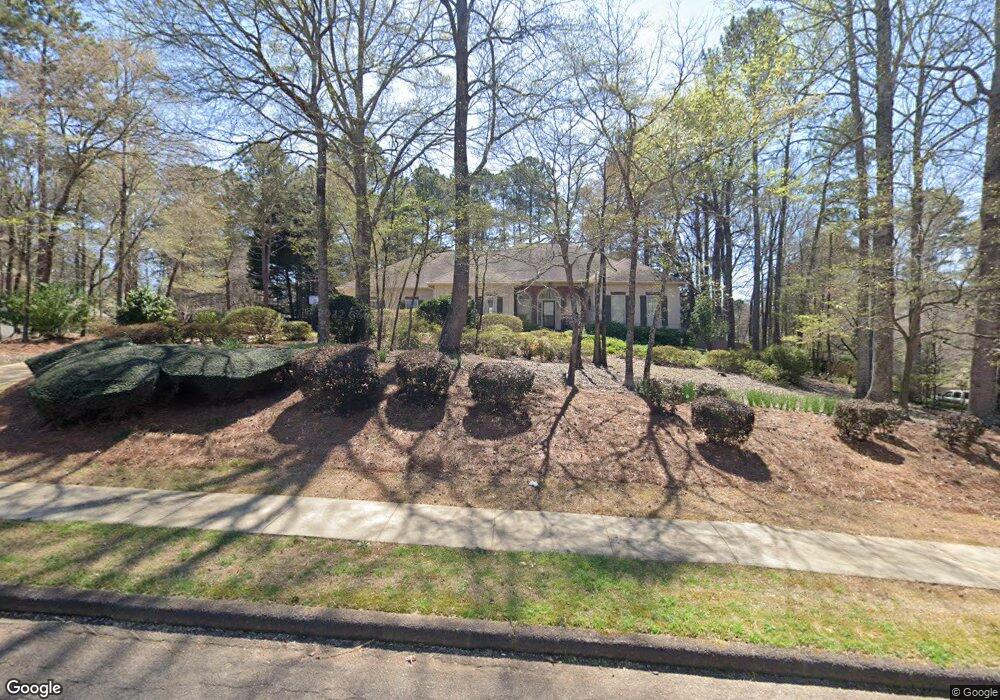
216 Ashford Cir Lagrange, GA 30240
Estimated Value: $383,000 - $444,000
4
Beds
4
Baths
2,679
Sq Ft
$152/Sq Ft
Est. Value
About This Home
This home is located at 216 Ashford Cir, Lagrange, GA 30240 and is currently estimated at $408,093, approximately $152 per square foot. 216 Ashford Cir is a home located in Troup County with nearby schools including Franklin Forest Elementary School, Hollis Hand Elementary School, and Ethel W. Kight Elementary School.
Ownership History
Date
Name
Owned For
Owner Type
Purchase Details
Closed on
Sep 15, 2006
Sold by
Stevenson James L
Bought by
Clement Jerry M
Current Estimated Value
Purchase Details
Closed on
Sep 10, 2004
Sold by
Vann Brannon and Vann Deborah
Bought by
Stevenson James L
Purchase Details
Closed on
May 27, 1997
Sold by
Thomas I Yates
Bought by
Vann Brannon and Vann Deborah
Purchase Details
Closed on
Jun 29, 1996
Sold by
Norman Ray French
Bought by
Thomas I Yates
Purchase Details
Closed on
Mar 7, 1994
Sold by
Duncan Thos R and Duncan Adine
Bought by
Norman Ray French
Purchase Details
Closed on
Jun 17, 1991
Sold by
West Ga Estates Inc
Bought by
Duncan Thos R and Duncan Adine
Purchase Details
Closed on
Jun 13, 1991
Bought by
West Ga Estates Inc
Purchase Details
Closed on
Jun 14, 1985
Sold by
Heinrich J Boggess
Create a Home Valuation Report for This Property
The Home Valuation Report is an in-depth analysis detailing your home's value as well as a comparison with similar homes in the area
Home Values in the Area
Average Home Value in this Area
Purchase History
| Date | Buyer | Sale Price | Title Company |
|---|---|---|---|
| Clement Jerry M | $273,947 | -- | |
| Clement Jerry M | $273,947 | -- | |
| Stevenson James L | $240,000 | -- | |
| Vann Brannon | $180,000 | -- | |
| Thomas I Yates | $175,700 | -- | |
| Norman Ray French | $162,000 | -- | |
| Duncan Thos R | $168,000 | -- | |
| West Ga Estates Inc | -- | -- | |
| -- | -- | -- |
Source: Public Records
Tax History Compared to Growth
Tax History
| Year | Tax Paid | Tax Assessment Tax Assessment Total Assessment is a certain percentage of the fair market value that is determined by local assessors to be the total taxable value of land and additions on the property. | Land | Improvement |
|---|---|---|---|---|
| 2024 | $3,375 | $131,560 | $18,000 | $113,560 |
| 2023 | $3,214 | $125,648 | $14,000 | $111,648 |
| 2022 | $3,068 | $117,648 | $14,000 | $103,648 |
| 2021 | $3,012 | $107,632 | $14,000 | $93,632 |
| 2020 | $3,186 | $107,632 | $14,000 | $93,632 |
| 2019 | $3,137 | $106,000 | $16,000 | $90,000 |
| 2018 | $3,137 | $106,000 | $16,000 | $90,000 |
| 2017 | $3,137 | $106,000 | $16,000 | $90,000 |
| 2016 | $3,116 | $105,309 | $16,000 | $89,309 |
| 2015 | $3,122 | $105,309 | $16,000 | $89,309 |
| 2014 | $3,071 | $103,468 | $16,000 | $87,468 |
| 2013 | -- | $101,816 | $16,000 | $85,816 |
Source: Public Records
Map
Nearby Homes
- 118 Moss Creek Dr
- 107 Windridge
- 104 Hidden Branches Ln
- 109 Windridge
- LOT 106 River Oaks Dr
- 105 Ridgeview Dr
- 117 Woodchase
- 127 Oakmont Dr
- 209 River Oaks Dr
- 129 Sunny Point Cir
- 127 Ashling Dr
- 91 Richmond Dr
- 1784 New Franklin Rd
- 100 Creekside Dr Unit LOT 60A
- 107 Dixie Creek Dr
- 89 Chase Rd
- 106 S Chilton Crescent
- 203 S Chilton Crescent
- 201 S Chilton Crescent
- 106 Highland Park
- 218 Ashford Cir
- 214 Ashford Cir
- 104 Saint Angela Merici Ct
- 104 St Angela Merici
- 106 Saint Angela Merici Ct
- 102 Saint Angela Merici Ct
- 215 Ashford Cir
- 217 Ashford Cir
- 220 Ashford Cir
- 219 Ashford Cir
- 212 Ashford Cir
- 213 Ashford Cir
- 100 Saint Angela Merici Ct
- 108 Saint Angela Merici Ct
- 221 Ashford Cir
- 105 St Angela Merici Ct
- 222 Ashford Cir
- 103 Saint Angela Merici Ct
- 210 Ashford Cir
- 211 Ashford Cir