216 Boyd Dr Richmond Hill, GA 31324
Estimated Value: $306,000 - $338,000
3
Beds
2
Baths
1,597
Sq Ft
$202/Sq Ft
Est. Value
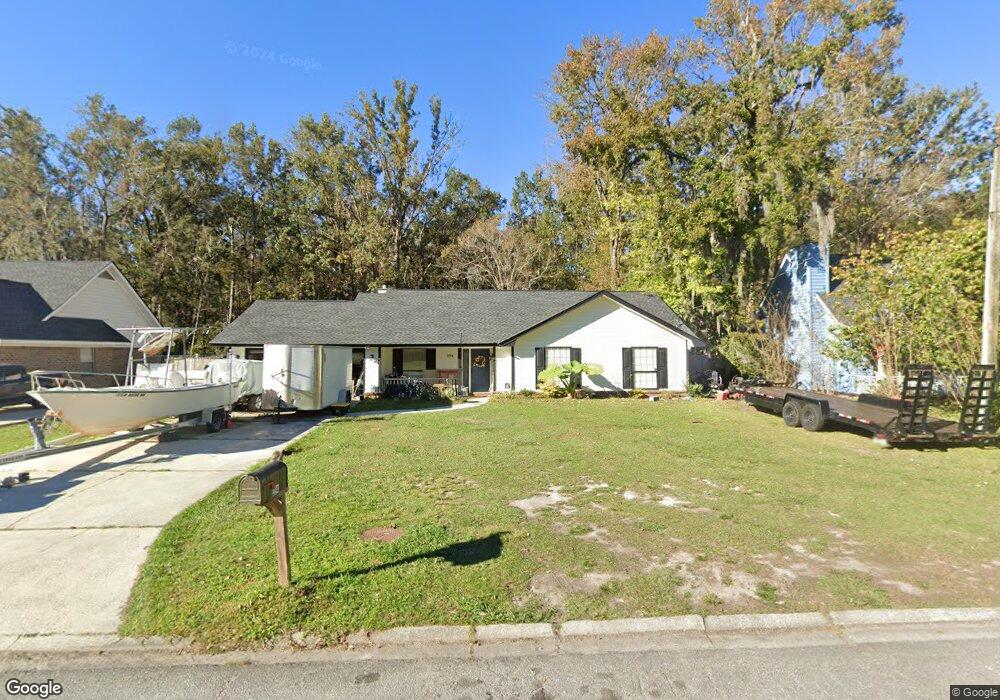
About This Home
This home is located at 216 Boyd Dr, Richmond Hill, GA 31324 and is currently estimated at $322,778, approximately $202 per square foot. 216 Boyd Dr is a home with nearby schools including Richmond Hill Primary School, Dr. George Washington Carver Elementary School, and Richmond Hill Elementary School.
Ownership History
Date
Name
Owned For
Owner Type
Purchase Details
Closed on
Aug 13, 2012
Sold by
Yancey Kim
Bought by
Yancey Jay D
Current Estimated Value
Purchase Details
Closed on
Aug 2, 2012
Sold by
Yancey Kim
Bought by
Yancey Jay D
Purchase Details
Closed on
Feb 22, 2011
Sold by
Yancey Jay D
Bought by
Yancey Kim
Purchase Details
Closed on
Jun 16, 2006
Sold by
Toms Terry C
Bought by
Yancey Jay D
Home Financials for this Owner
Home Financials are based on the most recent Mortgage that was taken out on this home.
Original Mortgage
$183,767
Interest Rate
6.57%
Mortgage Type
VA
Purchase Details
Closed on
Jul 14, 2000
Sold by
Williams Elizabeth K
Bought by
Toms Terry C and Toms Loret
Purchase Details
Closed on
Jun 22, 2000
Sold by
Bayens Bayens J and Bayens Ke
Bought by
Williams Elizabeth K
Purchase Details
Closed on
Apr 1, 1995
Bought by
Bayens Bayens J and Bayens Ke
Purchase Details
Closed on
Feb 1, 1989
Purchase Details
Closed on
Sep 1, 1988
Create a Home Valuation Report for This Property
The Home Valuation Report is an in-depth analysis detailing your home's value as well as a comparison with similar homes in the area
Home Values in the Area
Average Home Value in this Area
Purchase History
| Date | Buyer | Sale Price | Title Company |
|---|---|---|---|
| Yancey Jay D | -- | -- | |
| Yancey Jay D | -- | -- | |
| Yancey Kim | -- | -- | |
| Yancey Jay D | $179,900 | -- | |
| Toms Terry C | $126,000 | -- | |
| Williams Elizabeth K | $113,500 | -- | |
| Bayens Bayens J | $93,500 | -- | |
| -- | $77,200 | -- | |
| -- | $29,500 | -- |
Source: Public Records
Mortgage History
| Date | Status | Borrower | Loan Amount |
|---|---|---|---|
| Previous Owner | Yancey Jay D | $183,767 |
Source: Public Records
Tax History Compared to Growth
Tax History
| Year | Tax Paid | Tax Assessment Tax Assessment Total Assessment is a certain percentage of the fair market value that is determined by local assessors to be the total taxable value of land and additions on the property. | Land | Improvement |
|---|---|---|---|---|
| 2024 | $2,790 | $98,000 | $26,000 | $72,000 |
| 2023 | $2,836 | $82,040 | $26,000 | $56,040 |
| 2022 | $2,474 | $80,080 | $26,000 | $54,080 |
| 2021 | $2,189 | $69,800 | $26,000 | $43,800 |
| 2020 | $2,026 | $69,800 | $26,000 | $43,800 |
| 2019 | $1,963 | $60,760 | $22,000 | $38,760 |
| 2018 | $1,599 | $54,200 | $18,000 | $36,200 |
| 2017 | $1,424 | $51,840 | $16,000 | $35,840 |
| 2016 | $1,408 | $50,880 | $16,000 | $34,880 |
| 2015 | $1,405 | $50,280 | $16,000 | $34,280 |
| 2014 | $1,336 | $47,720 | $12,480 | $35,240 |
Source: Public Records
Map
Nearby Homes
- 334 Boyd Dr
- 155 Alexander Way
- 128 Landing Way
- 10 Ross Way
- 30 Walker Ct
- 75 Golden Rod Loop
- 97 & 115 Ivey St
- 581 Laurel Hill Cir
- 116 Ivey St
- 5 Golden Rod Loop
- 270 Monterey Loop
- 285 Monterey Loop
- 295 Monterey Loop
- 292 Vining Way
- 52 Sedgefield Ct
- 590 Dogwood Way
- 45 Grove Park Dr
- 176 Shady Oak Cir
- 224 Dogwood Way
- 204 Dogwood Way