Estimated Value: $311,619 - $397,000
4
Beds
3
Baths
2,024
Sq Ft
$169/Sq Ft
Est. Value
About This Home
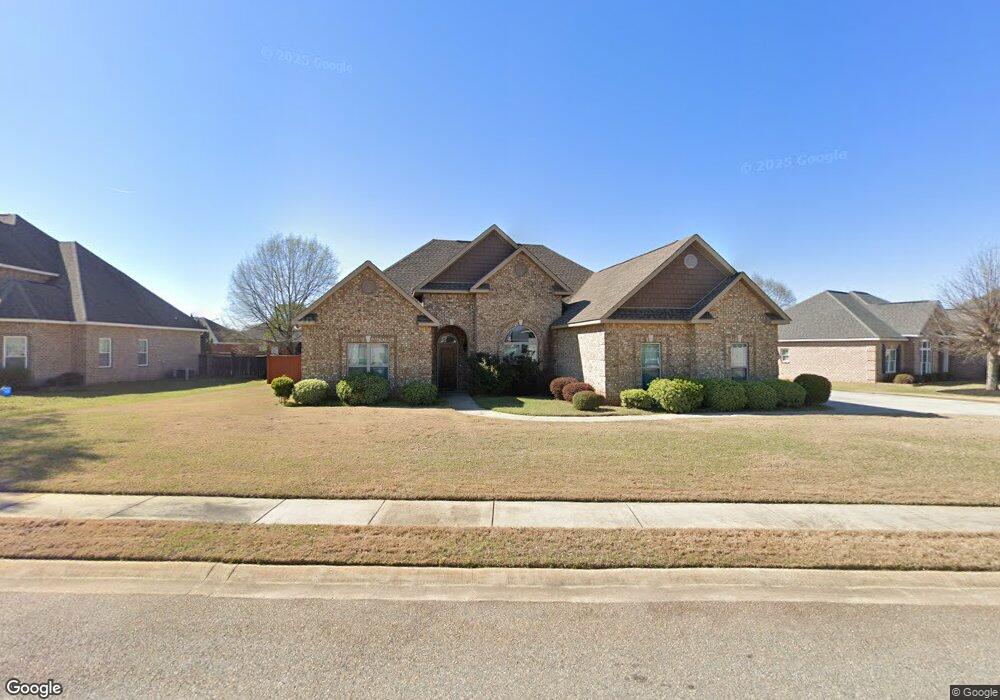
This home is located at 216 Caleb Way, Byron, GA 31008 and is currently estimated at $341,155, approximately $168 per square foot. 216 Caleb Way is a home located in Peach County with nearby schools including Byron Elementary School, Byron Middle School, and Peach County High School.
Ownership History
Date
Name
Owned For
Owner Type
Purchase Details
Closed on
Nov 3, 2016
Sold by
Project Dev & Management Llc
Bought by
Roberts Willie F
Current Estimated Value
Home Financials for this Owner
Home Financials are based on the most recent Mortgage that was taken out on this home.
Original Mortgage
$205,000
Outstanding Balance
$162,802
Interest Rate
3.42%
Mortgage Type
VA
Estimated Equity
$178,353
Purchase Details
Closed on
Oct 6, 2015
Sold by
Alexis Investments Llc
Bought by
Project Development & Manage
Home Financials for this Owner
Home Financials are based on the most recent Mortgage that was taken out on this home.
Original Mortgage
$18,892
Interest Rate
3.94%
Mortgage Type
New Conventional
Purchase Details
Closed on
Feb 24, 2011
Sold by
Newton Development Llc
Bought by
Alexis Investments Llc
Purchase Details
Closed on
Aug 11, 2008
Sold by
Preston Development Llc
Bought by
Newton Development Llc
Purchase Details
Closed on
Jul 26, 2006
Bought by
Preston Development Llc
Create a Home Valuation Report for This Property
The Home Valuation Report is an in-depth analysis detailing your home's value as well as a comparison with similar homes in the area
Home Values in the Area
Average Home Value in this Area
Purchase History
| Date | Buyer | Sale Price | Title Company |
|---|---|---|---|
| Roberts Willie F | $210,000 | -- | |
| Project Development & Manage | $21,900 | -- | |
| Alexis Investments Llc | -- | -- | |
| Newton Development Llc | -- | -- | |
| Preston Development Llc | -- | -- |
Source: Public Records
Mortgage History
| Date | Status | Borrower | Loan Amount |
|---|---|---|---|
| Open | Roberts Willie F | $205,000 | |
| Previous Owner | Project Development & Manage | $18,892 |
Source: Public Records
Tax History
| Year | Tax Paid | Tax Assessment Tax Assessment Total Assessment is a certain percentage of the fair market value that is determined by local assessors to be the total taxable value of land and additions on the property. | Land | Improvement |
|---|---|---|---|---|
| 2025 | $4,115 | $132,720 | $12,680 | $120,040 |
| 2024 | $4,209 | $119,440 | $12,480 | $106,960 |
| 2023 | $4,157 | $117,240 | $10,000 | $107,240 |
| 2022 | $2,666 | $101,040 | $7,000 | $94,040 |
| 2021 | $2,574 | $84,440 | $7,000 | $77,440 |
| 2020 | $2,302 | $75,720 | $7,000 | $68,720 |
| 2019 | $2,313 | $75,720 | $7,000 | $68,720 |
| 2018 | $2,388 | $75,720 | $7,000 | $68,720 |
| 2017 | $2,157 | $68,080 | $7,000 | $61,080 |
| 2016 | $221 | $7,000 | $7,000 | $0 |
| 2015 | -- | $4,880 | $4,880 | $0 |
| 2014 | $154 | $4,880 | $4,880 | $0 |
| 2013 | -- | $4,880 | $4,880 | $0 |
Source: Public Records
Map
Nearby Homes
- 217 Caleb Way
- 260 Caleb Way
- 118 Manchester Ln
- 108 Manchester Ln
- 706 Georgian Walk
- 107 Monroe Ct
- 104 Monroe Ct
- 102 Monroe Ct
- 100 Monroe Ct
- 508 Georgian Walk
- 105 Browning Point
- 503 Georgian Walk
- 504 Georgian Walk
- 721 Georgian Walk
- 732 Georgian Walk
- 502 Georgian Walk
- 220 Summerstone Bend
- 110 Bulloch Ct
- 205 White Rd
- 118 Bulloch Ct
- 214 Caleb Way
- 218 Caleb Way
- 505 Manchester Ln
- 507 Manchester Ln
- 220 Caleb Way Unit 23
- 220 Caleb Way
- 212 Caleb Way
- 219 Caleb Way
- 509 Manchester Ln
- 503 Manchester Ln
- 215 Caleb Way
- 221 Caleb Way
- 221 Caleb Way Unit 24L
- 213 Caleb Way
- 511 Manchester Ln
- 210 Caleb Way
- 222 Caleb Way
- 501 Manchester Ln
- 211 Caleb Way
- 223 Caleb Way
Your Personal Tour Guide
Ask me questions while you tour the home.