Estimated Value: $167,000 - $190,000
3
Beds
2
Baths
1,164
Sq Ft
$150/Sq Ft
Est. Value
About This Home
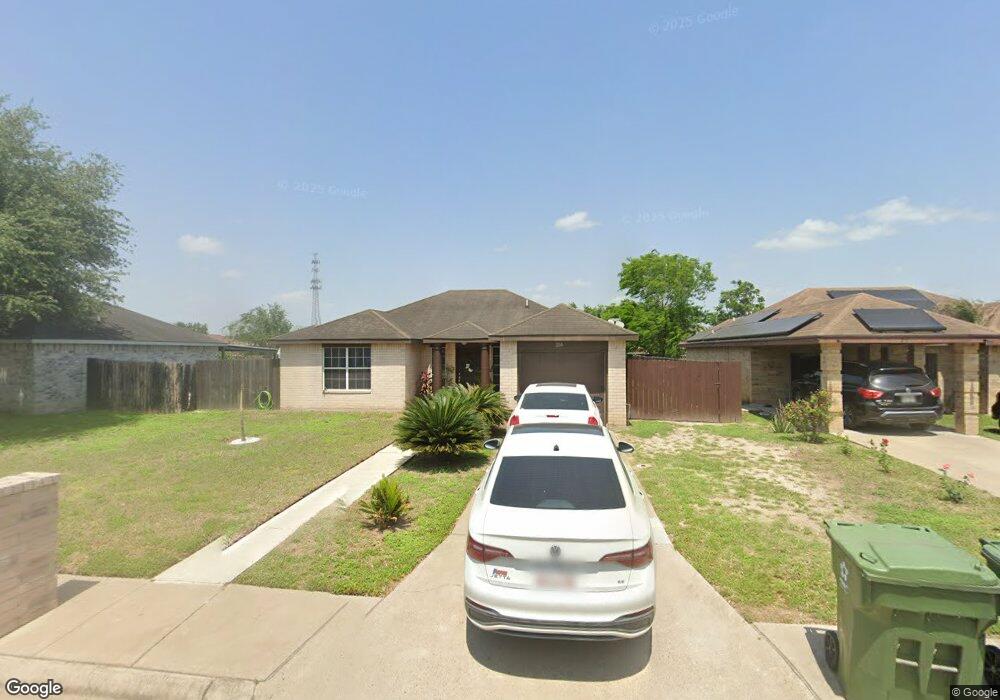
This home is located at 216 Caramel Dr, Alamo, TX 78516 and is currently estimated at $174,663, approximately $150 per square foot. 216 Caramel Dr is a home located in Hidalgo County with nearby schools including Capt. D. Salinas Elementary School, A.P. Solis Middle School, and Donna High School.
Ownership History
Date
Name
Owned For
Owner Type
Purchase Details
Closed on
Jul 27, 2018
Sold by
Ditech Financial Llc
Bought by
Sema Manuel A Gonzalez and Gonzalez Reyna L Mendoza De
Current Estimated Value
Purchase Details
Closed on
Apr 3, 2018
Sold by
Garza Mateo and Garza Maria E
Bought by
Ditech Financial Llc
Purchase Details
Closed on
Feb 14, 2014
Sold by
Green Tree Servicing Llc
Bought by
Garcia Garza Mateo and Garcia De Garza Maria E
Purchase Details
Closed on
Feb 4, 2014
Sold by
Aguilar Homero and Aguilar Carmen E
Bought by
Green Tree Servicing Llc
Purchase Details
Closed on
Jan 27, 2006
Sold by
Landmark Valley Homes Inc
Bought by
Aguilar Homero and Aguilar Carmen E
Home Financials for this Owner
Home Financials are based on the most recent Mortgage that was taken out on this home.
Original Mortgage
$74,872
Interest Rate
6.22%
Mortgage Type
Purchase Money Mortgage
Create a Home Valuation Report for This Property
The Home Valuation Report is an in-depth analysis detailing your home's value as well as a comparison with similar homes in the area
Home Values in the Area
Average Home Value in this Area
Purchase History
| Date | Buyer | Sale Price | Title Company |
|---|---|---|---|
| Sema Manuel A Gonzalez | -- | None Available | |
| Ditech Financial Llc | $85,000 | None Available | |
| Garcia Garza Mateo | -- | None Available | |
| Green Tree Servicing Llc | $86,000 | None Available | |
| Aguilar Homero | -- | None Available |
Source: Public Records
Mortgage History
| Date | Status | Borrower | Loan Amount |
|---|---|---|---|
| Previous Owner | Aguilar Homero | $74,872 | |
| Closed | Garcia Garza Mateo | $0 |
Source: Public Records
Tax History Compared to Growth
Tax History
| Year | Tax Paid | Tax Assessment Tax Assessment Total Assessment is a certain percentage of the fair market value that is determined by local assessors to be the total taxable value of land and additions on the property. | Land | Improvement |
|---|---|---|---|---|
| 2025 | $2,514 | $152,900 | -- | -- |
| 2023 | $3,633 | $142,721 | $30,420 | $112,301 |
| 2022 | $3,433 | $131,759 | $30,420 | $101,339 |
| 2021 | $2,969 | $113,151 | $28,860 | $84,291 |
| 2020 | $2,882 | $106,310 | $28,470 | $77,840 |
| 2019 | $2,522 | $91,981 | $28,470 | $63,511 |
| 2018 | $2,544 | $93,379 | $28,470 | $64,909 |
| 2017 | $2,359 | $85,533 | $19,500 | $66,033 |
| 2016 | $2,337 | $84,724 | $17,940 | $66,784 |
| 2015 | $2,048 | $85,474 | $17,940 | $67,534 |
Source: Public Records
Map
Nearby Homes