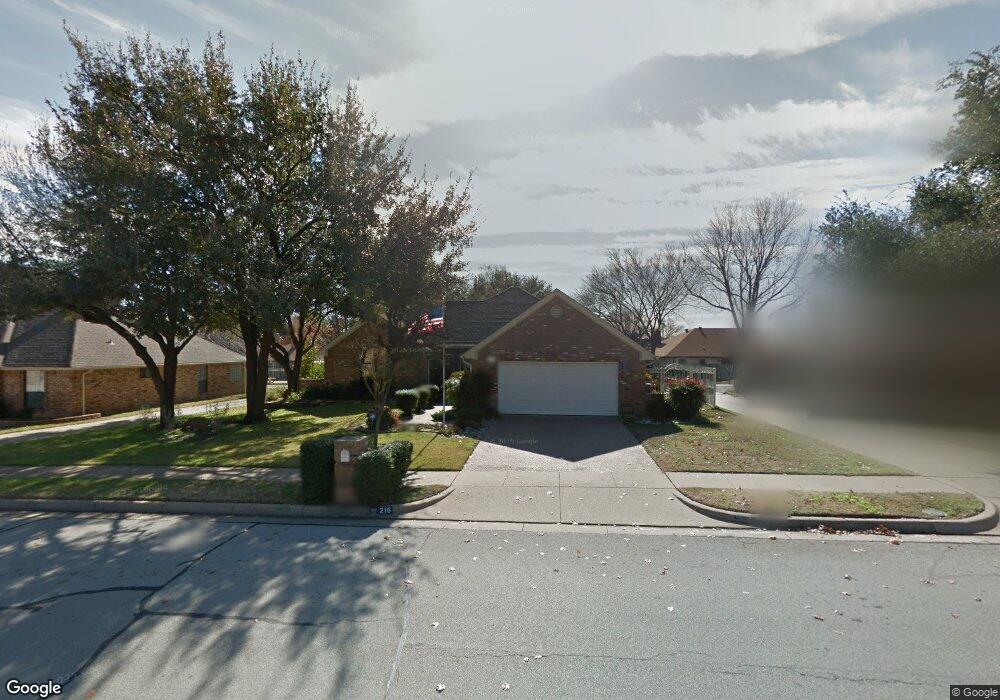
216 Carolyn Dr Bedford, TX 76021
Estimated Value: $375,000 - $402,000
3
Beds
2
Baths
1,984
Sq Ft
$194/Sq Ft
Est. Value
About This Home
This home is located at 216 Carolyn Dr, Bedford, TX 76021 and is currently estimated at $385,489, approximately $194 per square foot. 216 Carolyn Dr is a home located in Tarrant County with nearby schools including Bedford Heights Elementary School, Bedford Junior High School, and L.D. Bell High School.
Ownership History
Date
Name
Owned For
Owner Type
Purchase Details
Closed on
Mar 25, 2010
Sold by
Wilson Jarvis Earl and Wilson Alma Jean
Bought by
Wilson Alma Jean
Current Estimated Value
Purchase Details
Closed on
Oct 6, 2005
Sold by
West Kevin A and West Patricia M
Bought by
Wilson Jarvis E and Wilson Alma J
Purchase Details
Closed on
May 25, 1999
Sold by
Courtney Ronald J and Courtney Mary Janet
Bought by
Lewis Jon Michael and Lewis Deanna M
Home Financials for this Owner
Home Financials are based on the most recent Mortgage that was taken out on this home.
Original Mortgage
$127,710
Interest Rate
6.89%
Purchase Details
Closed on
Oct 21, 1996
Sold by
Mitchamore Scott K and Mitchamore Leslie
Bought by
Lewis Jon Michael
Home Financials for this Owner
Home Financials are based on the most recent Mortgage that was taken out on this home.
Original Mortgage
$98,600
Interest Rate
8.15%
Create a Home Valuation Report for This Property
The Home Valuation Report is an in-depth analysis detailing your home's value as well as a comparison with similar homes in the area
Home Values in the Area
Average Home Value in this Area
Purchase History
| Date | Buyer | Sale Price | Title Company |
|---|---|---|---|
| Wilson Alma Jean | -- | None Available | |
| Wilson Jarvis E | -- | American Title | |
| Lewis Jon Michael | -- | Commonwealth Land Title | |
| West Kevin A | -- | American Title Co | |
| Lewis Jon Michael | -- | Rattikin Title Co |
Source: Public Records
Mortgage History
| Date | Status | Borrower | Loan Amount |
|---|---|---|---|
| Previous Owner | West Kevin A | $127,710 | |
| Previous Owner | West Kevin A | $174,000 | |
| Previous Owner | Lewis Jon Michael | $98,600 |
Source: Public Records
Tax History Compared to Growth
Tax History
| Year | Tax Paid | Tax Assessment Tax Assessment Total Assessment is a certain percentage of the fair market value that is determined by local assessors to be the total taxable value of land and additions on the property. | Land | Improvement |
|---|---|---|---|---|
| 2025 | $1,491 | $368,441 | $75,000 | $293,441 |
| 2024 | $1,491 | $368,441 | $75,000 | $293,441 |
| 2023 | $6,843 | $372,417 | $55,000 | $317,417 |
| 2022 | $7,084 | $329,148 | $55,000 | $274,148 |
| 2021 | $6,946 | $294,868 | $55,000 | $239,868 |
| 2020 | $6,386 | $268,586 | $55,000 | $213,586 |
| 2019 | $6,146 | $280,188 | $55,000 | $225,188 |
| 2018 | $2,892 | $229,997 | $55,000 | $174,997 |
| 2017 | $5,058 | $216,565 | $18,000 | $198,565 |
| 2016 | $4,598 | $203,359 | $18,000 | $185,359 |
| 2015 | $2,903 | $172,800 | $18,000 | $154,800 |
| 2014 | $2,903 | $172,800 | $18,000 | $154,800 |
Source: Public Records
Map
Nearby Homes
- 432 Sunnybrook Ct
- 320 Blue Quail Ct
- 305 Warbler Dr
- 121 Kay Ct
- 124 Jeannie Ct
- 1732 Jeannie Ln
- 421 Cavender Ct
- 404 Heather Ln
- 2212 Mountainview Dr
- 3213 Spring Valley Dr
- 405 Woodbriar Ct
- 817 Shady Lake Dr
- 3119 Spring Grove Dr
- 2212 Hurstview Dr
- 1740 Brown Trail
- 440 W Louella Dr
- 801 Shady Creek Ln
- 2244 Hurstview Dr
- 100 Hillview Ct
- 2436 Brookgreen Ct
- 212 Carolyn Dr
- 220 Carolyn Dr
- 108 Mountain View Dr
- 110 Mountain View Dr
- 106 Mountain View Dr
- 112 Mountain View Dr
- 224 Carolyn Dr
- 208 Carolyn Dr
- 104 Mountain View Dr
- 102 Mountain View Dr
- 217 Carolyn Dr
- 221 Carolyn Dr
- 3000 Shenandoah Dr
- 100 Mountain View Dr
- 116 Mountain View Dr
- 204 Carolyn Dr
- 225 Carolyn Dr
- 118 Mountain View Dr
- 3004 Shenandoah Dr
- 300 Carolyn Dr