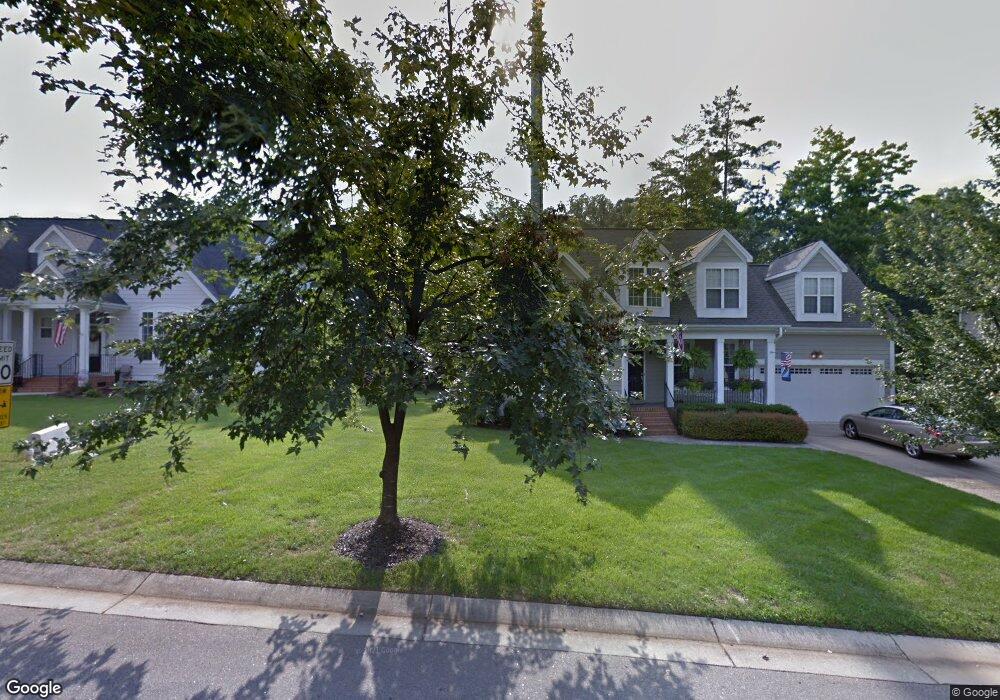
216 Cobblepoint Way Holly Springs, NC 27540
Estimated Value: $805,000 - $1,034,000
4
Beds
4
Baths
3,155
Sq Ft
$293/Sq Ft
Est. Value
About This Home
This home is located at 216 Cobblepoint Way, Holly Springs, NC 27540 and is currently estimated at $924,751, approximately $293 per square foot. 216 Cobblepoint Way is a home located in Wake County with nearby schools including Holly Ridge Elementary School, Holly Ridge Middle School, and Holly Springs High School.
Ownership History
Date
Name
Owned For
Owner Type
Purchase Details
Closed on
Dec 31, 2012
Sold by
Coleman James Robert and Coleman Laverna
Bought by
Edwards Lance Sterling and Edwards Erin M
Current Estimated Value
Home Financials for this Owner
Home Financials are based on the most recent Mortgage that was taken out on this home.
Original Mortgage
$355,000
Outstanding Balance
$246,948
Interest Rate
3.38%
Mortgage Type
New Conventional
Estimated Equity
$677,803
Purchase Details
Closed on
Nov 16, 2009
Sold by
Coleman James Robert and Coleman Laverna
Bought by
Kowalke Elizabeth C and Kowalke David S
Purchase Details
Closed on
Jun 7, 2006
Sold by
Tri South Development Inc
Bought by
Coleman James Robert and Coleman Laverna
Create a Home Valuation Report for This Property
The Home Valuation Report is an in-depth analysis detailing your home's value as well as a comparison with similar homes in the area
Home Values in the Area
Average Home Value in this Area
Purchase History
| Date | Buyer | Sale Price | Title Company |
|---|---|---|---|
| Edwards Lance Sterling | $455,000 | None Available | |
| Kowalke Elizabeth C | -- | None Available | |
| Coleman James Robert | $47,000 | Network Title Agency Inc |
Source: Public Records
Mortgage History
| Date | Status | Borrower | Loan Amount |
|---|---|---|---|
| Open | Edwards Lance Sterling | $355,000 |
Source: Public Records
Tax History Compared to Growth
Tax History
| Year | Tax Paid | Tax Assessment Tax Assessment Total Assessment is a certain percentage of the fair market value that is determined by local assessors to be the total taxable value of land and additions on the property. | Land | Improvement |
|---|---|---|---|---|
| 2025 | $7,066 | $818,741 | $120,000 | $698,741 |
| 2024 | $7,037 | $818,741 | $120,000 | $698,741 |
| 2023 | $5,788 | $534,782 | $50,000 | $484,782 |
| 2022 | $5,588 | $534,782 | $50,000 | $484,782 |
| 2021 | $5,483 | $534,782 | $50,000 | $484,782 |
| 2020 | $5,483 | $534,782 | $50,000 | $484,782 |
| 2019 | $6,092 | $504,686 | $50,000 | $454,686 |
| 2018 | $5,505 | $504,686 | $50,000 | $454,686 |
| 2017 | $5,307 | $504,686 | $50,000 | $454,686 |
| 2016 | $5,233 | $504,686 | $50,000 | $454,686 |
| 2015 | $5,820 | $552,604 | $51,000 | $501,604 |
| 2014 | $5,618 | $552,604 | $51,000 | $501,604 |
Source: Public Records
Map
Nearby Homes
- 112 Midden Way
- 228 Masden Rd
- 0/416 Holly Springs Rd
- 225 Old Ride Dr
- 208 Old Ride Dr
- 0 Old Ride Dr
- 204 Crossway Ln
- 217 Jones Hill Rd
- 215 Savannah Ridge Rd Unit 215
- 413 Rhamkatte Rd
- 305 Savannah Ridge Rd
- 129 Starwood Ln
- 204 Chrismill Ln
- 4809 Greenpoint Ln
- 116 Cabrita Ct
- 5200 Gable Ridge Ln
- 109 Lacombe Ct
- 208 Apple Drupe Way
- 5620 Lockley Rd
- 504 Prince Dr
- 220 Cobblepoint Way
- 404 Landbridge Ln
- 400 Landbridge Ln
- 212 Cobblepoint Way
- 204 Cobblepoint Way
- 224 Cobblepoint Way
- 405 Landbridge Ln
- 401 Landbridge Ln
- 209 Cobblepoint Way
- 120 Cobblepoint Way
- 213 Cobblepoint Way
- 205 Cobblepoint Way
- 229 Cobblepoint Way
- 217 Cobblepoint Way
- 201 Cobblepoint Way
- 200 Wyecreek Cir
- 116 Cobblepoint Way
- 221 Cobblepoint Way
- 113 Sunset Grove Dr
- 125 Cobblepoint Way