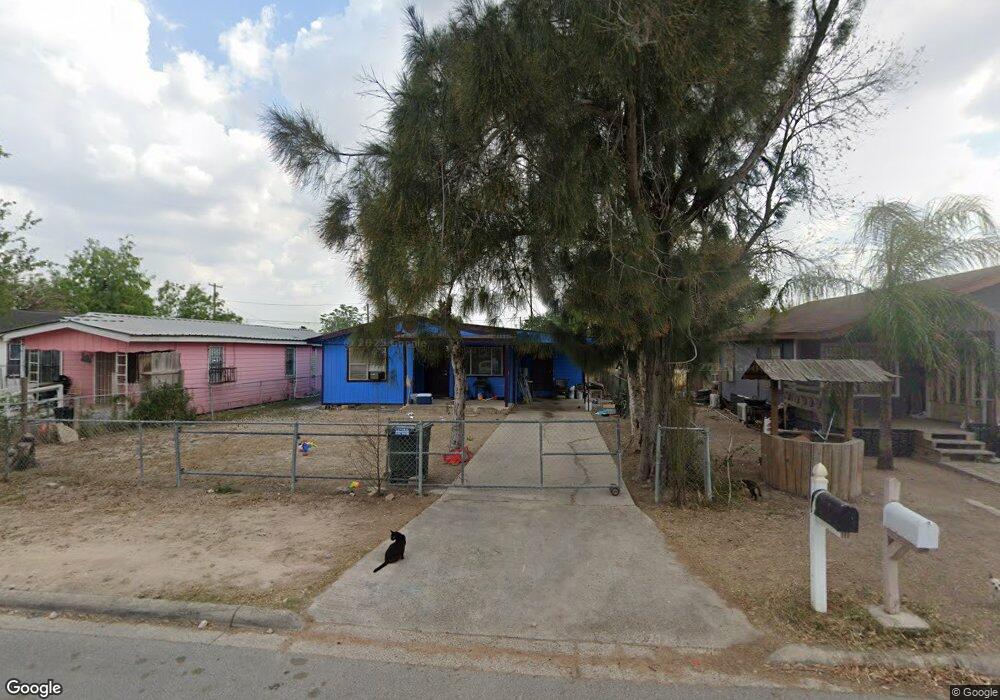
216 E 2nd St San Juan, TX 78589
Estimated Value: $113,000 - $156,000
2
Beds
1
Bath
1,176
Sq Ft
$118/Sq Ft
Est. Value
About This Home
This home is located at 216 E 2nd St, San Juan, TX 78589 and is currently estimated at $138,905, approximately $118 per square foot. 216 E 2nd St is a home located in Hidalgo County with nearby schools including Vida N. Clover Elementary, Stephen F. Austin Middle School, and PSJA Early College High School.
Ownership History
Date
Name
Owned For
Owner Type
Purchase Details
Closed on
Oct 13, 2018
Sold by
Coastal Bend Investments
Bought by
Villalon Ocanas Aaron Alvarez and Villalon Arango Nancy Aracely
Current Estimated Value
Home Financials for this Owner
Home Financials are based on the most recent Mortgage that was taken out on this home.
Original Mortgage
$40,000
Outstanding Balance
$24,844
Interest Rate
4.5%
Mortgage Type
Purchase Money Mortgage
Estimated Equity
$114,061
Purchase Details
Closed on
Jan 6, 2016
Sold by
Martinez Cirilo and Martinez Maria
Bought by
Martinez Francisco
Purchase Details
Closed on
Jul 12, 2007
Sold by
Garza Florinda
Bought by
Reyes Cirilo Martinez and Martinez Maria
Home Financials for this Owner
Home Financials are based on the most recent Mortgage that was taken out on this home.
Original Mortgage
$20,000
Interest Rate
6.47%
Mortgage Type
Seller Take Back
Create a Home Valuation Report for This Property
The Home Valuation Report is an in-depth analysis detailing your home's value as well as a comparison with similar homes in the area
Home Values in the Area
Average Home Value in this Area
Purchase History
| Date | Buyer | Sale Price | Title Company |
|---|---|---|---|
| Villalon Ocanas Aaron Alvarez | -- | None Available | |
| Martinez Francisco | -- | None Available | |
| Reyes Cirilo Martinez | -- | None Available |
Source: Public Records
Mortgage History
| Date | Status | Borrower | Loan Amount |
|---|---|---|---|
| Open | Villalon Ocanas Aaron Alvarez | $40,000 | |
| Previous Owner | Reyes Cirilo Martinez | $20,000 |
Source: Public Records
Tax History Compared to Growth
Tax History
| Year | Tax Paid | Tax Assessment Tax Assessment Total Assessment is a certain percentage of the fair market value that is determined by local assessors to be the total taxable value of land and additions on the property. | Land | Improvement |
|---|---|---|---|---|
| 2025 | $2,608 | $132,656 | $43,050 | $89,606 |
| 2024 | $2,608 | $100,653 | $43,050 | $57,603 |
| 2023 | $2,606 | $100,653 | $43,050 | $57,603 |
| 2022 | $2,163 | $78,248 | $32,900 | $45,348 |
| 2021 | $1,975 | $69,892 | $32,900 | $36,992 |
| 2020 | $1,874 | $65,209 | $32,900 | $32,309 |
| 2019 | $1,305 | $43,792 | $19,250 | $24,542 |
| 2018 | $1,315 | $43,879 | $19,250 | $24,629 |
| 2017 | $1,327 | $43,965 | $19,250 | $24,715 |
| 2016 | $1,150 | $38,111 | $14,700 | $23,411 |
| 2015 | $1,259 | $38,685 | $14,700 | $23,985 |
Source: Public Records
Map
Nearby Homes
- 303 E 2nd St
- 212 E 1st St
- 319 E 3rd St
- 321 E 3rd St
- 204 E 4th St
- 413 Zapata St
- 405 Zapata St
- 411 Zapata St
- 111 N Nebraska Ave
- 412 Zapata St
- 0000 U S 83 Business
- 414 Liza St
- 91 San Juan
- 213 W 2nd St
- 423 E Railroad St
- 310 W 2nd St
- 503 (IH2) E Expressway 83 Hwy
- 117 W 6th St
- 622 S Nebraska Ave
- 301 E 8th St