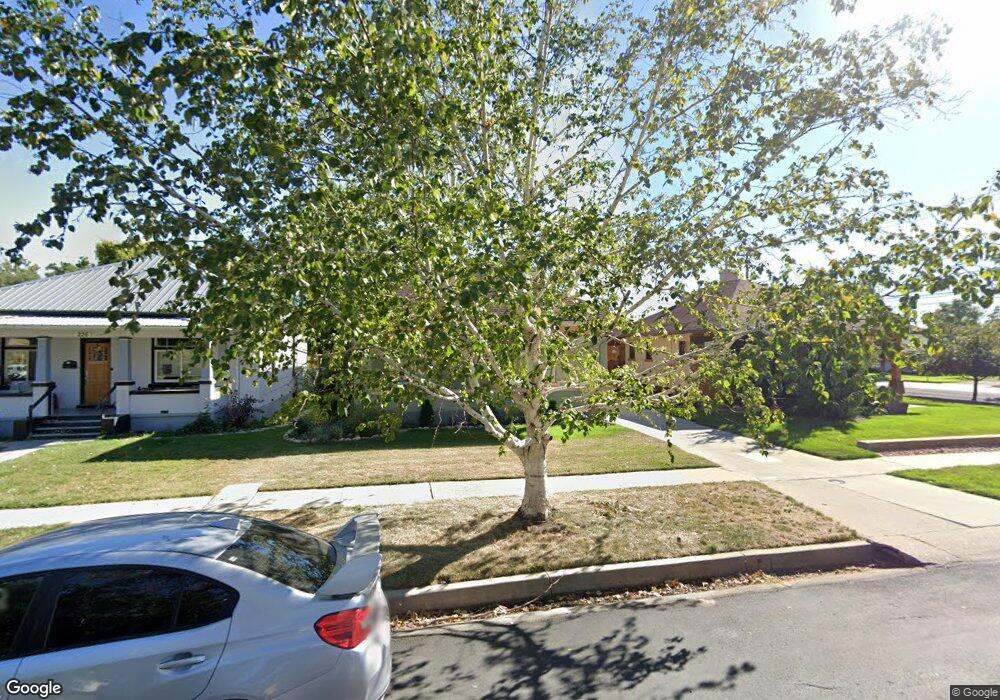
216 E 400 S Provo, UT 84606
Provost NeighborhoodEstimated Value: $416,682 - $447,000
3
Beds
1
Bath
1,561
Sq Ft
$275/Sq Ft
Est. Value
About This Home
This home is located at 216 E 400 S, Provo, UT 84606 and is currently estimated at $429,561, approximately $275 per square foot. 216 E 400 S is a home located in Utah County with nearby schools including Provo Peaks School, Centennial Middle School, and Timpview High School.
Ownership History
Date
Name
Owned For
Owner Type
Purchase Details
Closed on
Nov 20, 2019
Sold by
Tyler Vernon L and Tyler Marilyn D
Bought by
Hatch Kadon Akiwa and Hatch Anne Elizabeth
Current Estimated Value
Home Financials for this Owner
Home Financials are based on the most recent Mortgage that was taken out on this home.
Original Mortgage
$219,093
Outstanding Balance
$192,359
Interest Rate
3.5%
Mortgage Type
New Conventional
Estimated Equity
$237,202
Create a Home Valuation Report for This Property
The Home Valuation Report is an in-depth analysis detailing your home's value as well as a comparison with similar homes in the area
Home Values in the Area
Average Home Value in this Area
Purchase History
| Date | Buyer | Sale Price | Title Company |
|---|---|---|---|
| Hatch Kadon Akiwa | -- | Inwest Title Orem |
Source: Public Records
Mortgage History
| Date | Status | Borrower | Loan Amount |
|---|---|---|---|
| Open | Hatch Kadon Akiwa | $219,093 |
Source: Public Records
Tax History
| Year | Tax Paid | Tax Assessment Tax Assessment Total Assessment is a certain percentage of the fair market value that is determined by local assessors to be the total taxable value of land and additions on the property. | Land | Improvement |
|---|---|---|---|---|
| 2025 | $2,115 | $212,465 | -- | -- |
| 2024 | $2,115 | $208,230 | $0 | $0 |
| 2023 | $2,154 | $209,000 | $0 | $0 |
| 2022 | $2,145 | $209,880 | $0 | $0 |
| 2021 | $1,565 | $267,100 | $119,100 | $148,000 |
| 2020 | $1,510 | $241,600 | $108,300 | $133,300 |
| 2019 | $1,441 | $239,700 | $108,300 | $131,400 |
| 2018 | $1,279 | $215,900 | $101,600 | $114,300 |
| 2017 | $1,167 | $108,240 | $0 | $0 |
| 2016 | $1,093 | $94,435 | $0 | $0 |
| 2015 | $994 | $86,790 | $0 | $0 |
| 2014 | $924 | $84,150 | $0 | $0 |
Source: Public Records
Map
Nearby Homes
Your Personal Tour Guide
Ask me questions while you tour the home.