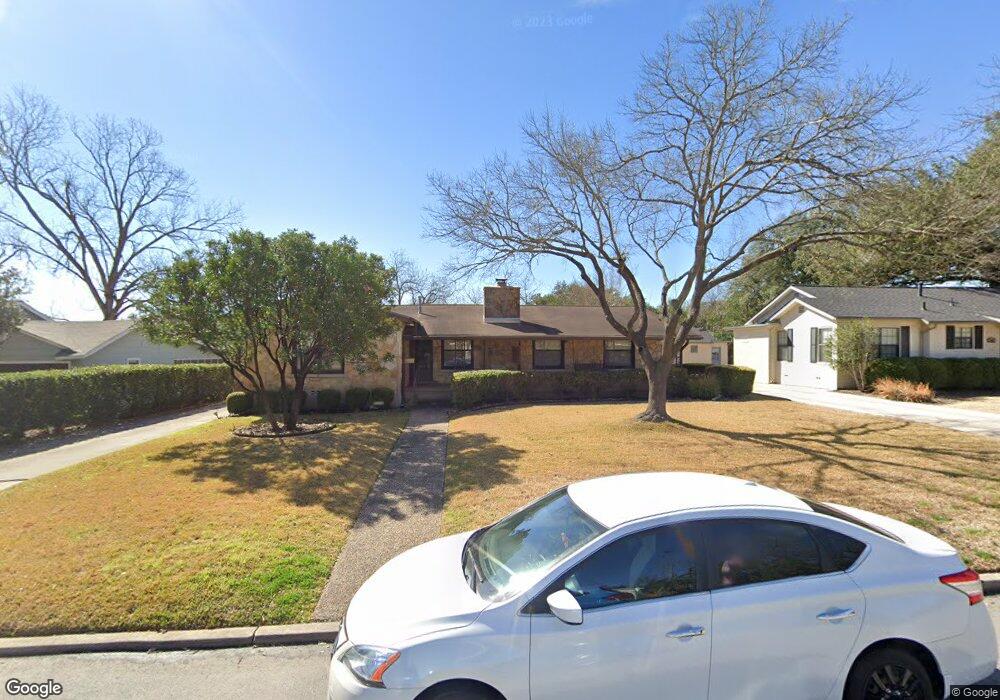
216 E Nottingham Dr San Antonio, TX 78209
Oak Park-Northwood NeighborhoodEstimated Value: $590,000 - $739,000
3
Beds
2
Baths
2,214
Sq Ft
$297/Sq Ft
Est. Value
About This Home
This home is located at 216 E Nottingham Dr, San Antonio, TX 78209 and is currently estimated at $657,919, approximately $297 per square foot. 216 E Nottingham Dr is a home located in Bexar County with nearby schools including Cambridge Elementary School, Alamo Heights Junior School, and Alamo Heights High School.
Ownership History
Date
Name
Owned For
Owner Type
Purchase Details
Closed on
Jan 4, 2013
Sold by
Burk Kathryn B and Estates Of Joseph Paul Summa
Bought by
Vonhartmann Engel Iii Herbert Carl and Von Hartmann Engel Alison
Current Estimated Value
Home Financials for this Owner
Home Financials are based on the most recent Mortgage that was taken out on this home.
Original Mortgage
$336,787
Outstanding Balance
$232,409
Interest Rate
3.21%
Mortgage Type
FHA
Estimated Equity
$425,510
Purchase Details
Closed on
Jun 24, 2005
Sold by
Thompson Jon C and Thompson Mary Jane T
Bought by
Summa Joseph Paul
Purchase Details
Closed on
Apr 30, 2004
Sold by
Bludeau Herbert L and Emley Eileen A
Bought by
Thompson Jon C and Thompson Mary Jane T
Home Financials for this Owner
Home Financials are based on the most recent Mortgage that was taken out on this home.
Original Mortgage
$128,544
Interest Rate
5.38%
Mortgage Type
Purchase Money Mortgage
Purchase Details
Closed on
Aug 30, 1995
Sold by
Harlos Magdalen E
Bought by
Harlos Magdalen E and Magdalen E Harlos Qualified Pe
Create a Home Valuation Report for This Property
The Home Valuation Report is an in-depth analysis detailing your home's value as well as a comparison with similar homes in the area
Home Values in the Area
Average Home Value in this Area
Purchase History
| Date | Buyer | Sale Price | Title Company |
|---|---|---|---|
| Vonhartmann Engel Iii Herbert Carl | -- | Itc | |
| Summa Joseph Paul | -- | Presidio Title | |
| Thompson Jon C | -- | -- | |
| Harlos Magdalen E | -- | -- |
Source: Public Records
Mortgage History
| Date | Status | Borrower | Loan Amount |
|---|---|---|---|
| Open | Vonhartmann Engel Iii Herbert Carl | $336,787 | |
| Previous Owner | Thompson Jon C | $128,544 | |
| Closed | Thompson Jon C | $32,136 |
Source: Public Records
Tax History Compared to Growth
Tax History
| Year | Tax Paid | Tax Assessment Tax Assessment Total Assessment is a certain percentage of the fair market value that is determined by local assessors to be the total taxable value of land and additions on the property. | Land | Improvement |
|---|---|---|---|---|
| 2025 | $11,792 | $605,000 | $275,230 | $329,770 |
| 2024 | $11,792 | $630,000 | $275,230 | $354,770 |
| 2023 | $11,792 | $574,750 | $275,230 | $323,770 |
| 2022 | $12,649 | $522,500 | $190,080 | $344,920 |
| 2021 | $11,854 | $475,000 | $165,270 | $309,730 |
| 2020 | $11,243 | $450,000 | $114,110 | $335,890 |
| 2019 | $11,513 | $450,000 | $114,110 | $335,890 |
| 2018 | $11,273 | $450,000 | $114,110 | $335,890 |
| 2017 | $10,708 | $427,500 | $114,110 | $313,390 |
| 2016 | $10,558 | $421,500 | $102,740 | $318,760 |
| 2015 | $9,754 | $393,060 | $102,740 | $290,320 |
| 2014 | $9,754 | $393,060 | $0 | $0 |
Source: Public Records
Map
Nearby Homes
- 204 E Nottingham Dr
- 239 E Nottingham Dr
- 151 Brightwood Place
- 127 Brightwood Place
- 209 Calumet Place
- 7707 Broadway Unit 24A
- 7707 Broadway Unit 3
- 7711 Broadway Unit 16B
- 7711 Broadway Unit 8B
- 7711 Broadway Unit 26C
- 144 E Oakview Place
- 7731 Broadway St Unit K142
- 7731 Broadway St Unit I-42
- 411 E Nottingham Dr
- 7709 Broadway Unit 321
- 7815 Broadway St Unit 202
- 7815 Broadway St Unit 201
- 7815 Broadway St Unit 408D
- 129 E Elmview Place
- 128 E Elmview Place
- 220 E Nottingham Dr
- 212 E Nottingham Dr
- 224 E Nottingham Dr
- 208 E Nottingham Dr
- 123 Robinhood Place
- 119 Robinhood Place
- 115 Robinhood Place
- 205 Robinhood Place
- 215 E Nottingham Dr
- 228 E Nottingham Dr
- 211 E Nottingham Dr
- 223 E Nottingham Dr
- 111 Robinhood Place
- 209 Robinhood Place
- 219 E Nottingham Dr
- 234 E Nottingham Dr
- 200 E Nottingham Dr
- 227 E Nottingham Dr
- 107 Robinhood Place
- 202 Robinhood Place