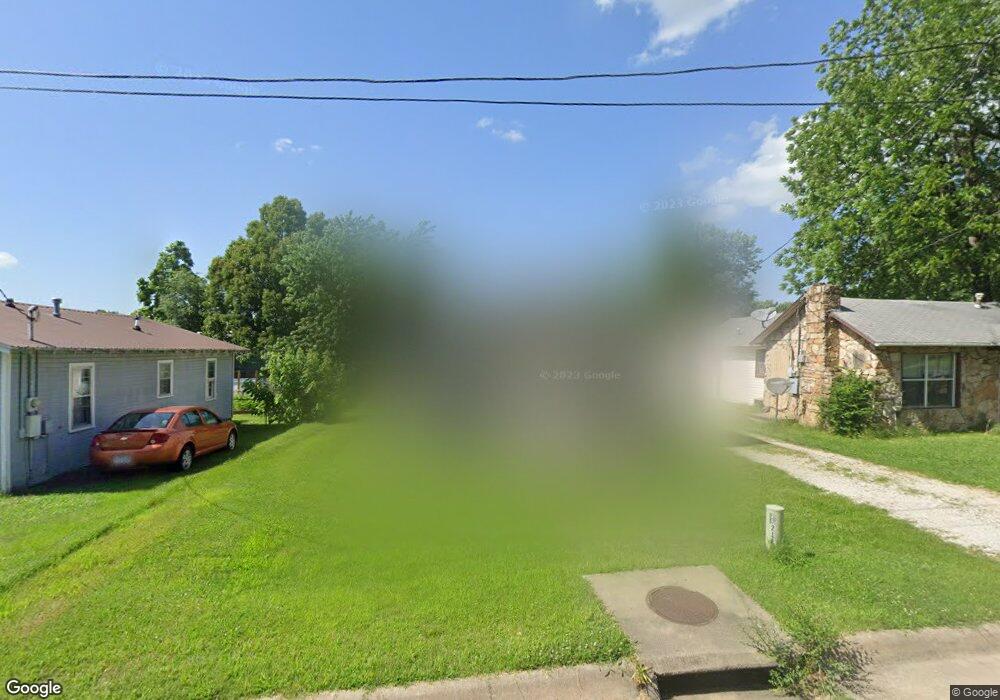
216 E Velma Ave Springdale, AR 72764
Estimated Value: $159,639 - $204,000
--
Bed
1
Bath
1,014
Sq Ft
$182/Sq Ft
Est. Value
About This Home
This home is located at 216 E Velma Ave, Springdale, AR 72764 and is currently estimated at $184,410, approximately $181 per square foot. 216 E Velma Ave is a home located in Washington County with nearby schools including Jones Elementary School, J. O. Kelly Middle School, and George Junior High School.
Ownership History
Date
Name
Owned For
Owner Type
Purchase Details
Closed on
May 22, 2015
Bought by
Ld Gibson Properties Llc
Current Estimated Value
Purchase Details
Closed on
Sep 3, 2004
Sold by
Hud
Bought by
Gibson Larry J
Home Financials for this Owner
Home Financials are based on the most recent Mortgage that was taken out on this home.
Original Mortgage
$48,000
Interest Rate
6%
Mortgage Type
Purchase Money Mortgage
Purchase Details
Closed on
May 21, 2004
Sold by
Hickman Joshua L
Bought by
The Leader Mortgage Co Llc and The Leader Mortgage Co
Purchase Details
Closed on
May 6, 2004
Sold by
The Leader Mortgage Co Llc
Bought by
Hud
Purchase Details
Closed on
Mar 1, 1995
Bought by
Hickman Del and Hickman Robin
Purchase Details
Closed on
Feb 26, 1993
Bought by
Stith Lonnie and Stith Roberta
Purchase Details
Closed on
Jun 6, 1986
Bought by
Croxton George R and Croxton Effie M
Purchase Details
Closed on
Jan 1, 1985
Bought by
Self Bobby G and Verna May
Create a Home Valuation Report for This Property
The Home Valuation Report is an in-depth analysis detailing your home's value as well as a comparison with similar homes in the area
Home Values in the Area
Average Home Value in this Area
Purchase History
| Date | Buyer | Sale Price | Title Company |
|---|---|---|---|
| Ld Gibson Properties Llc | -- | -- | |
| Gibson Larry J | -- | Three Rivers Title Svcs Inc | |
| The Leader Mortgage Co Llc | $62,617 | -- | |
| Hud | -- | -- | |
| Hickman Del | $50,000 | -- | |
| Stith Lonnie | $25,000 | -- | |
| Croxton George R | $29,000 | -- | |
| Self Bobby G | -- | -- |
Source: Public Records
Mortgage History
| Date | Status | Borrower | Loan Amount |
|---|---|---|---|
| Previous Owner | Gibson Larry J | $48,000 |
Source: Public Records
Tax History Compared to Growth
Tax History
| Year | Tax Paid | Tax Assessment Tax Assessment Total Assessment is a certain percentage of the fair market value that is determined by local assessors to be the total taxable value of land and additions on the property. | Land | Improvement |
|---|---|---|---|---|
| 2025 | $742 | $23,770 | $12,600 | $11,170 |
| 2024 | $685 | $23,770 | $12,600 | $11,170 |
| 2023 | $640 | $23,770 | $12,600 | $11,170 |
| 2022 | $582 | $13,310 | $5,500 | $7,810 |
| 2021 | $537 | $13,310 | $5,500 | $7,810 |
| 2020 | $492 | $13,310 | $5,500 | $7,810 |
| 2019 | $447 | $8,490 | $3,400 | $5,090 |
| 2018 | $447 | $8,490 | $3,400 | $5,090 |
| 2017 | $443 | $8,490 | $3,400 | $5,090 |
| 2016 | $443 | $8,490 | $3,400 | $5,090 |
| 2015 | $443 | $8,490 | $3,400 | $5,090 |
| 2014 | $540 | $10,340 | $4,250 | $6,090 |
Source: Public Records
Map
Nearby Homes
- 215 E Velma Ave
- 906 Holcomb St
- 323 Caudle Ave
- 604 Crutcher St Unit A
- 506 Caudle Ave
- 713 Maple Dr
- 522 Cormay Ct Unit A & B
- 614 S Cleveland St
- 1405 Young St
- 614 David St
- 710 E Meadow Ave
- 1115 Eicher Ave
- 5613 Southwood Ave
- 616 W Center Ave
- 0 Arkansas 265
- 301 Michael St
- 16937 Arkansas 265
- 17015 Arkansas 265
- 126 Rogers Circle Dr
- 1325 Rogers Ave
- 214 E Velma Ave
- 220 E Velma Ave
- 811 S Turner St
- 811 Turner St
- 821 Turner St
- 207 Hart Ave
- 801 Turner St
- 209 Hart Ave
- 217 E Velma Ave
- 808 Crutcher St
- 818 Crutcher St
- 814 Crutcher St Unit A
- 213 E Velma Ave
- 224 E Velma Ave
- 221 E Velma Ave
- Lot 5A Velma Ave
- 900 Crutcher St
- 804 Crutcher St
- 907 Turner St
- 909 Turner St