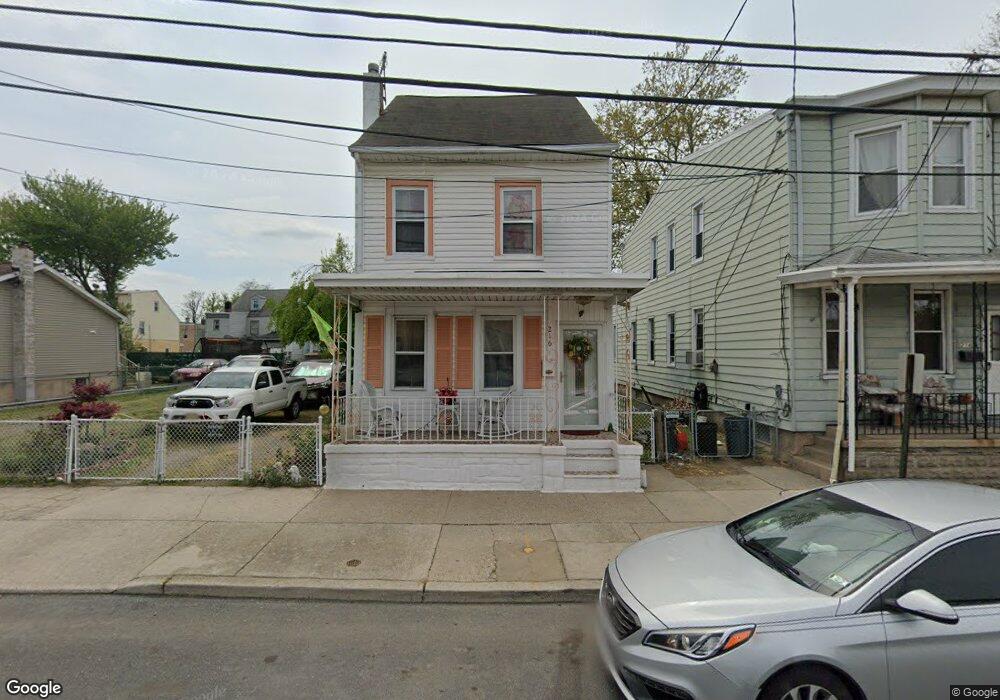
216 Essex St Gloucester City, NJ 08030
Estimated Value: $190,000 - $221,000
--
Bed
--
Bath
1,408
Sq Ft
$146/Sq Ft
Est. Value
About This Home
This home is located at 216 Essex St, Gloucester City, NJ 08030 and is currently estimated at $206,031, approximately $146 per square foot. 216 Essex St is a home located in Camden County with nearby schools including Cold Springs School, Gloucester City Middle School, and Gloucester City Junior/Senior High School.
Ownership History
Date
Name
Owned For
Owner Type
Purchase Details
Closed on
Aug 22, 2007
Sold by
Cammarota Mike and Cammarota Kathleen
Bought by
Cereceda Felix and Garcia Lydia
Current Estimated Value
Home Financials for this Owner
Home Financials are based on the most recent Mortgage that was taken out on this home.
Original Mortgage
$91,000
Interest Rate
6.74%
Mortgage Type
New Conventional
Purchase Details
Closed on
Jun 30, 1999
Sold by
Brennan Francis L
Bought by
Bahumundi Betty
Home Financials for this Owner
Home Financials are based on the most recent Mortgage that was taken out on this home.
Original Mortgage
$30,000
Interest Rate
8.1%
Purchase Details
Closed on
Jan 26, 1998
Sold by
Estate Of Anna Callaghan
Bought by
Brennan Joan S
Create a Home Valuation Report for This Property
The Home Valuation Report is an in-depth analysis detailing your home's value as well as a comparison with similar homes in the area
Home Values in the Area
Average Home Value in this Area
Purchase History
| Date | Buyer | Sale Price | Title Company |
|---|---|---|---|
| Cereceda Felix | $114,000 | -- | |
| Bahumundi Betty | $50,000 | -- | |
| Brennan Joan S | $21,500 | -- |
Source: Public Records
Mortgage History
| Date | Status | Borrower | Loan Amount |
|---|---|---|---|
| Previous Owner | Cereceda Felix | $91,000 | |
| Previous Owner | Bahumundi Betty | $30,000 |
Source: Public Records
Tax History Compared to Growth
Tax History
| Year | Tax Paid | Tax Assessment Tax Assessment Total Assessment is a certain percentage of the fair market value that is determined by local assessors to be the total taxable value of land and additions on the property. | Land | Improvement |
|---|---|---|---|---|
| 2025 | $4,442 | $88,600 | $30,400 | $58,200 |
| 2024 | $4,434 | $88,600 | $30,400 | $58,200 |
| 2023 | $4,434 | $88,600 | $30,400 | $58,200 |
| 2022 | $4,169 | $88,600 | $30,400 | $58,200 |
| 2021 | $4,127 | $88,600 | $30,400 | $58,200 |
| 2020 | $3,985 | $88,600 | $30,400 | $58,200 |
| 2019 | $3,904 | $88,600 | $30,400 | $58,200 |
| 2018 | $3,828 | $88,600 | $30,400 | $58,200 |
| 2017 | $3,749 | $88,600 | $30,400 | $58,200 |
| 2016 | $3,607 | $88,600 | $30,400 | $58,200 |
| 2015 | $3,248 | $88,600 | $30,400 | $58,200 |
| 2014 | $3,205 | $61,100 | $19,600 | $41,500 |
Source: Public Records
Map
Nearby Homes
- 230 N Burlington St
- 206 Morris St
- 323 Morris St
- 213 N Willow St
- 327 Mercer St
- 338 Morris St
- 215 Middlesex St
- 500 Essex St
- 314 Warren St
- 202 N Broadway
- 103 Middlesex St
- 200 N Broadway
- 313 Hudson St
- 344 Middlesex St
- 111 N Sussex St
- 325 Monmouth St
- 218 Somerset St
- 207 Hudson St
- 217 Cumberland St
- 803 Paul St