Estimated Value: $253,000 - $398,000
1
Bed
1
Bath
936
Sq Ft
$329/Sq Ft
Est. Value
About This Home
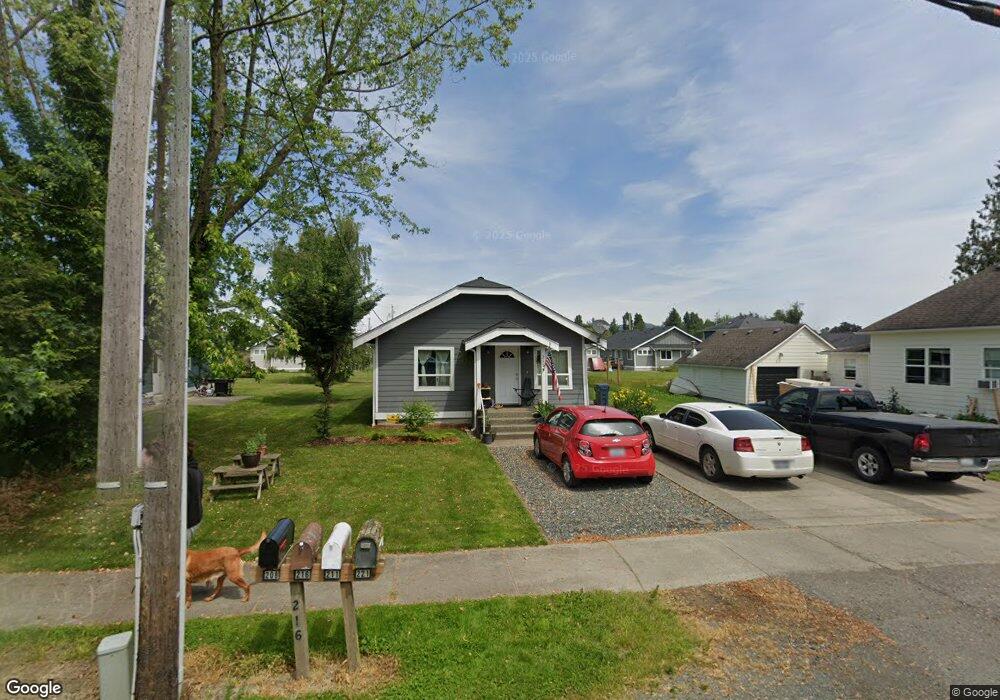
This home is located at 216 Front St, Sumas, WA 98295 and is currently estimated at $307,654, approximately $328 per square foot. 216 Front St is a home located in Whatcom County with nearby schools including Sumas Elementary School, Nooksack Elementary School, and Everson Elementary School.
Ownership History
Date
Name
Owned For
Owner Type
Purchase Details
Closed on
Oct 27, 2015
Sold by
Cristobal Mendoza Leticia L and Hernandez Lopez Marvin R
Bought by
Hernandez Lopez Marvin R
Current Estimated Value
Home Financials for this Owner
Home Financials are based on the most recent Mortgage that was taken out on this home.
Original Mortgage
$181,632
Outstanding Balance
$141,675
Interest Rate
3.87%
Mortgage Type
New Conventional
Estimated Equity
$165,979
Purchase Details
Closed on
Jun 7, 2013
Sold by
Girod Daniel L
Bought by
Larsen Erik and Larsen Anna
Home Financials for this Owner
Home Financials are based on the most recent Mortgage that was taken out on this home.
Original Mortgage
$19,000
Interest Rate
3.37%
Mortgage Type
Seller Take Back
Purchase Details
Closed on
Nov 21, 2000
Sold by
Vanderploeg Karl
Bought by
Girod Daniel Lewis
Create a Home Valuation Report for This Property
The Home Valuation Report is an in-depth analysis detailing your home's value as well as a comparison with similar homes in the area
Purchase History
We collect this data history from publicly available records. To have your information removed, we recommend requesting removal directly through your county’s website.
| Date | Buyer | Sale Price | Title Company |
|---|---|---|---|
| Hernandez Lopez Marvin R | -- | Chicago Title Insurance | |
| Hernandez Lopez Marvin R | $187,500 | Chicago Title Insurance | |
| Larsen Erik | $20,280 | None Available | |
| Girod Daniel Lewis | -- | -- |
Source: Public Records
Mortgage History
We collect this data history from publicly available records. To have your information removed, we recommend requesting removal directly through your county’s website.
| Date | Status | Borrower | Loan Amount |
|---|---|---|---|
| Open | Hernandez Lopez Marvin R | $181,632 | |
| Closed | Hernandez Lopez Marvin R | $7,265 | |
| Previous Owner | Larsen Erik | $19,000 |
Source: Public Records
Tax History
| Year | Tax Paid | Tax Assessment Tax Assessment Total Assessment is a certain percentage of the fair market value that is determined by local assessors to be the total taxable value of land and additions on the property. | Land | Improvement |
|---|---|---|---|---|
| 2025 | $2,358 | $254,189 | $122,265 | $131,924 |
| 2024 | $2,246 | $245,706 | $117,000 | $128,706 |
| 2023 | $2,246 | $232,271 | $103,308 | $128,963 |
| 2022 | $1,976 | $209,257 | $93,072 | $116,185 |
| 2021 | $1,878 | $172,942 | $76,920 | $96,022 |
| 2020 | $1,801 | $140,606 | $62,538 | $78,068 |
| 2019 | $1,525 | $140,606 | $62,538 | $78,068 |
| 2018 | $1,674 | $134,900 | $60,000 | $74,900 |
| 2017 | $1,492 | $112,531 | $32,480 | $80,051 |
| 2016 | $1,371 | $103,843 | $29,960 | $73,883 |
| 2015 | $631 | $99,626 | $28,896 | $70,730 |
| 2014 | -- | $49,418 | $28,000 | $21,418 |
| 2013 | -- | $49,418 | $28,000 | $21,418 |
Source: Public Records
Map
Nearby Homes
- 1116 Sumas Ave Unit 1
- 1116 Sumas Ave Unit 2
- 226 Morton St
- 232 Front St
- 235 Morton St
- 0 Washington 547
- 1305 Boon St Unit 213
- 310 Second St
- 517 Lawson St
- 304 Sumas Ave
- 4355 Jones Rd
- 125 Ridgeview St
- 9295 N Telegraph Rd
- 3650 E Badger Rd
- 4135 Kamphouse Dr
- 4315 Nordum Rd
- 5326 Reese Hill Rd
- 48 XX Reese Hill Rd
- 8388 N Pass Rd
- 9090 Van Buren Rd
- 215 Morton St Unit 217
- 207 Morton St Unit 207
- 207 Morton St Unit 209
- 221 Morton St Unit 223
- 223 Morton St
- 223 Morton St Unit 223 Morton Street.
- 225 Morton St Unit 227
- 208 Front St
- 222 Front St
- 229 Morton St
- 200 Front St
- 230 Morton St
- 1036 Sumas Ave
- 232 Morton St
- 1109 Sumas Ave
- 234 Morton St
- 0 W Front St
- 1107 Lawson St
- 244 Front St
- 146 Front St
Your Personal Tour Guide
Ask me questions while you tour the home.