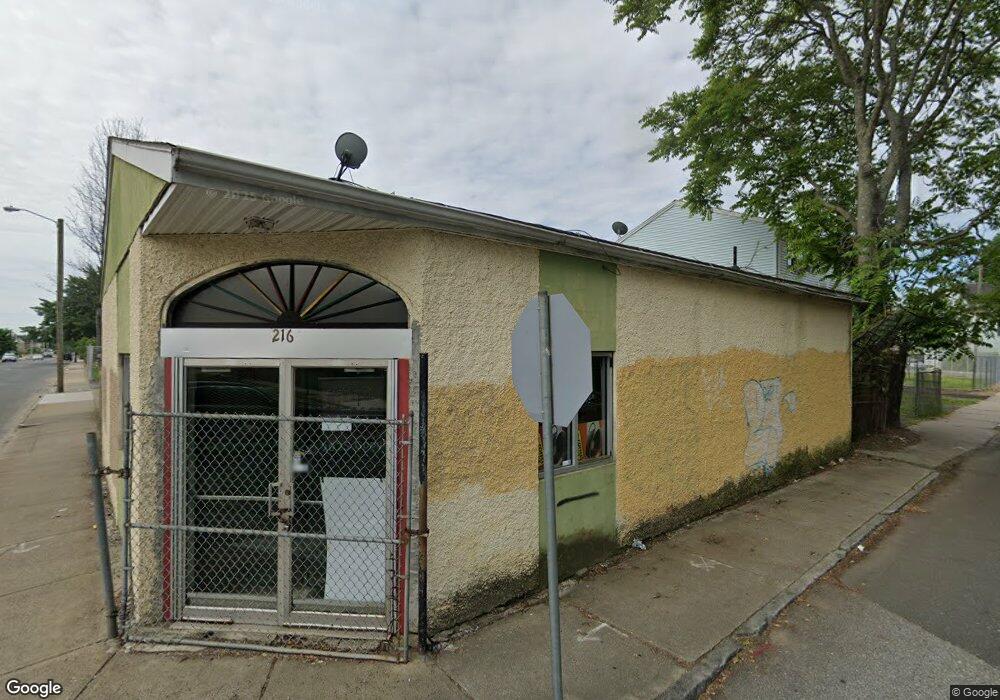
216 Hancock St Springfield, MA 01109
Old Hill NeighborhoodEstimated Value: $847,247
3
Beds
1
Bath
2,400
Sq Ft
$353/Sq Ft
Est. Value
About This Home
This home is located at 216 Hancock St, Springfield, MA 01109 and is currently estimated at $847,247, approximately $353 per square foot. 216 Hancock St is a home located in Hampden County with nearby schools including Elias Brookings School, M Marcus Kiley Middle, and High School Of Commerce.
Ownership History
Date
Name
Owned For
Owner Type
Purchase Details
Closed on
May 6, 2004
Sold by
Springfield City Of
Bought by
Spalding Arthur and Spalding Esmie
Current Estimated Value
Purchase Details
Closed on
Sep 5, 1990
Sold by
Webb Joseph A
Bought by
Burke Vilma
Home Financials for this Owner
Home Financials are based on the most recent Mortgage that was taken out on this home.
Original Mortgage
$140,000
Interest Rate
9.83%
Mortgage Type
Commercial
Create a Home Valuation Report for This Property
The Home Valuation Report is an in-depth analysis detailing your home's value as well as a comparison with similar homes in the area
Home Values in the Area
Average Home Value in this Area
Purchase History
| Date | Buyer | Sale Price | Title Company |
|---|---|---|---|
| Spalding Arthur | $1,000 | -- | |
| Burke Vilma | $200,000 | -- |
Source: Public Records
Mortgage History
| Date | Status | Borrower | Loan Amount |
|---|---|---|---|
| Open | Burke Vilma | $25,000 | |
| Previous Owner | Burke Vilma | $140,000 |
Source: Public Records
Tax History Compared to Growth
Tax History
| Year | Tax Paid | Tax Assessment Tax Assessment Total Assessment is a certain percentage of the fair market value that is determined by local assessors to be the total taxable value of land and additions on the property. | Land | Improvement |
|---|---|---|---|---|
| 2025 | $4,674 | $132,700 | $27,100 | $105,600 |
| 2024 | $4,345 | $122,700 | $25,400 | $97,300 |
| 2023 | $4,157 | $114,200 | $24,400 | $89,800 |
| 2022 | $4,076 | $104,400 | $19,100 | $85,300 |
| 2021 | $4,100 | $104,500 | $19,100 | $85,400 |
| 2020 | $3,943 | $100,500 | $19,100 | $81,400 |
| 2019 | $3,847 | $97,900 | $16,200 | $81,700 |
| 2018 | $3,846 | $97,900 | $16,200 | $81,700 |
| 2017 | $3,755 | $96,100 | $37,700 | $58,400 |
| 2016 | $3,435 | $89,000 | $37,700 | $51,300 |
| 2015 | $3,295 | $85,000 | $37,700 | $47,300 |
Source: Public Records
Map
Nearby Homes
- 51 Lebanon St Unit 53
- 52 Lebanon St
- 69 Lebanon St
- 46 Lebanon St
- 197 Hancock St
- 221 Hancock St
- 235 Hancock St
- 73 Lebanon St
- 29 Lebanon St
- 193 Hancock St
- 34 Lebanon St
- 194 Hancock St
- 79 Lebanon St Unit 81
- 189 Hancock St
- 229 Hancock St
- 229-231 Hancock St
- 246 Hancock St Unit 248
- 47 Queen St
- 30-32 Lebanon St
- 72 Lebanon St Unit 74