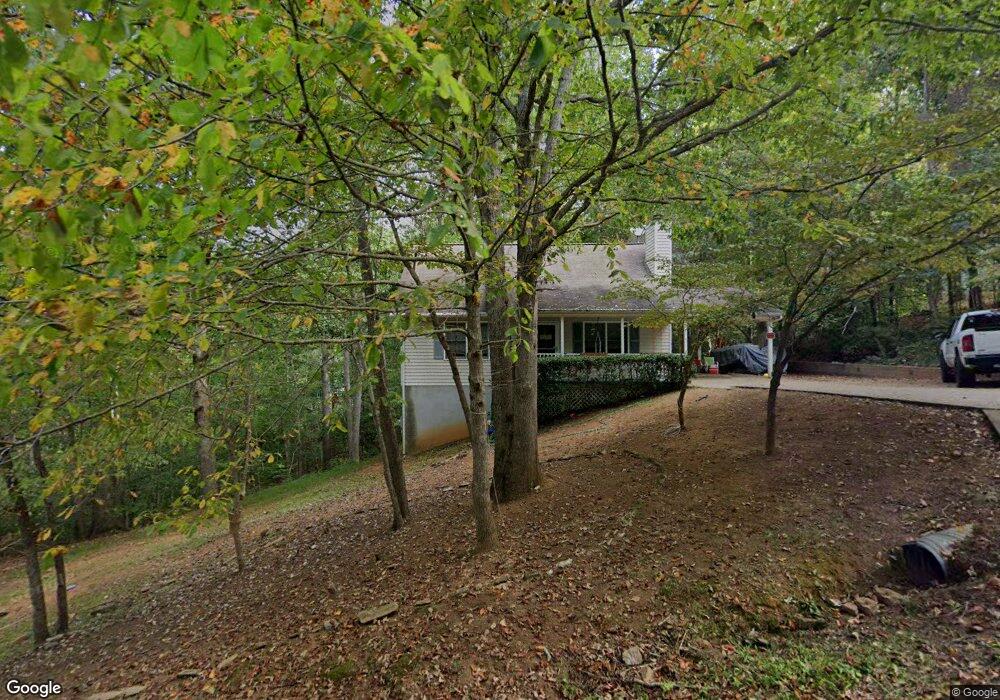
216 Hidden Cove Rd Dahlonega, GA 30533
Estimated Value: $297,449 - $336,000
3
Beds
2
Baths
1,547
Sq Ft
$201/Sq Ft
Est. Value
About This Home
This home is located at 216 Hidden Cove Rd, Dahlonega, GA 30533 and is currently estimated at $311,612, approximately $201 per square foot. 216 Hidden Cove Rd is a home located in Lumpkin County with nearby schools including Lumpkin County High School.
Ownership History
Date
Name
Owned For
Owner Type
Purchase Details
Closed on
Jul 9, 2019
Sold by
Grannis Henry N
Bought by
Stephens Bruce R and Stephens Stacy L
Current Estimated Value
Purchase Details
Closed on
Jul 15, 2009
Sold by
Hunt Evelyn R
Bought by
Grannis Henry and Grannis Darcy E
Home Financials for this Owner
Home Financials are based on the most recent Mortgage that was taken out on this home.
Original Mortgage
$127,382
Interest Rate
5.37%
Mortgage Type
VA
Purchase Details
Closed on
Oct 18, 1998
Bought by
Self Alvin D
Purchase Details
Closed on
Jun 19, 1993
Sold by
Hunt Evelyn
Bought by
Hunt Evelyn
Purchase Details
Closed on
Jun 18, 1993
Sold by
Hunt Evelyn
Bought by
Hunt Evelyn
Create a Home Valuation Report for This Property
The Home Valuation Report is an in-depth analysis detailing your home's value as well as a comparison with similar homes in the area
Home Values in the Area
Average Home Value in this Area
Purchase History
| Date | Buyer | Sale Price | Title Company |
|---|---|---|---|
| Stephens Bruce R | $165,000 | -- | |
| Grannis Henry | $135,500 | -- | |
| Self Alvin D | -- | -- | |
| Hunt Evelyn | $78,000 | -- | |
| Hunt Evelyn | -- | -- |
Source: Public Records
Mortgage History
| Date | Status | Borrower | Loan Amount |
|---|---|---|---|
| Previous Owner | Grannis Henry | $127,382 |
Source: Public Records
Tax History Compared to Growth
Tax History
| Year | Tax Paid | Tax Assessment Tax Assessment Total Assessment is a certain percentage of the fair market value that is determined by local assessors to be the total taxable value of land and additions on the property. | Land | Improvement |
|---|---|---|---|---|
| 2024 | $2,062 | $87,105 | $10,000 | $77,105 |
| 2023 | $1,880 | $79,912 | $8,000 | $71,912 |
| 2022 | $1,689 | $68,234 | $8,000 | $60,234 |
| 2021 | $1,484 | $57,980 | $8,000 | $49,980 |
| 2020 | $1,493 | $56,590 | $8,000 | $48,590 |
| 2019 | $1,606 | $56,590 | $8,000 | $48,590 |
| 2018 | $1,434 | $50,554 | $8,000 | $42,554 |
| 2017 | $0 | $48,527 | $8,000 | $40,527 |
| 2016 | $1,205 | $42,997 | $6,000 | $36,997 |
| 2015 | -- | $42,997 | $6,000 | $36,997 |
| 2014 | -- | $43,438 | $6,000 | $37,438 |
| 2013 | -- | $44,318 | $6,000 | $38,318 |
Source: Public Records
Map
Nearby Homes
- 4039 Highway 19 N
- 13 Hallmark Place
- 0 Ridley Rd Unit 7672007
- 0 Ridley Rd Unit 10632021
- 00 Cavender Creek Rd
- 122 Tritt Rd
- 1036 Wards Creek Dr
- 238 Grand View St
- 2589 Morrison Moore Pkwy E
- 00 LOT C Cavender Creek Rd
- 65 Golden Autumn Dr
- 46 Deer Acres Dr
- 85 Summit Canyon Rd Unit H102
- 34 Great Works Dr
- 77 Old River Rd
- 149 Highland Rd S
- 1556 Syrup Mill Rd
- 98 Elbert Gaddis Rd
- 1323 Cavender Creek Rd
- 159 Misty Way
- 187 Hidden Cove Rd
- 187 Hidden Cove Rd Unit 6
- 158 Hidden Cove Rd
- 213 Hidden Cove Rd
- 250 Hidden Cove Rd
- 256 Hidden Cove Rd Unit 11
- 256 Hidden Cove Rd
- 165 Hidden Cove Rd
- 261 Hidden Cove Rd
- 138 Hidden Cove Rd
- 249 Hidden Cove Rd
- 262 Hidden Cove Rd
- 100 Hidden Cove Rd
- 88 Hidden Cove Rd
- 131 Hidden Cove Rd
- 131 Hidden Cove Rd Unit 4
- 4903 Highway 19 N
- 58 Hidden Cove Rd
- 111 Hidden Cove Rd
- 81 Hidden Cove Rd