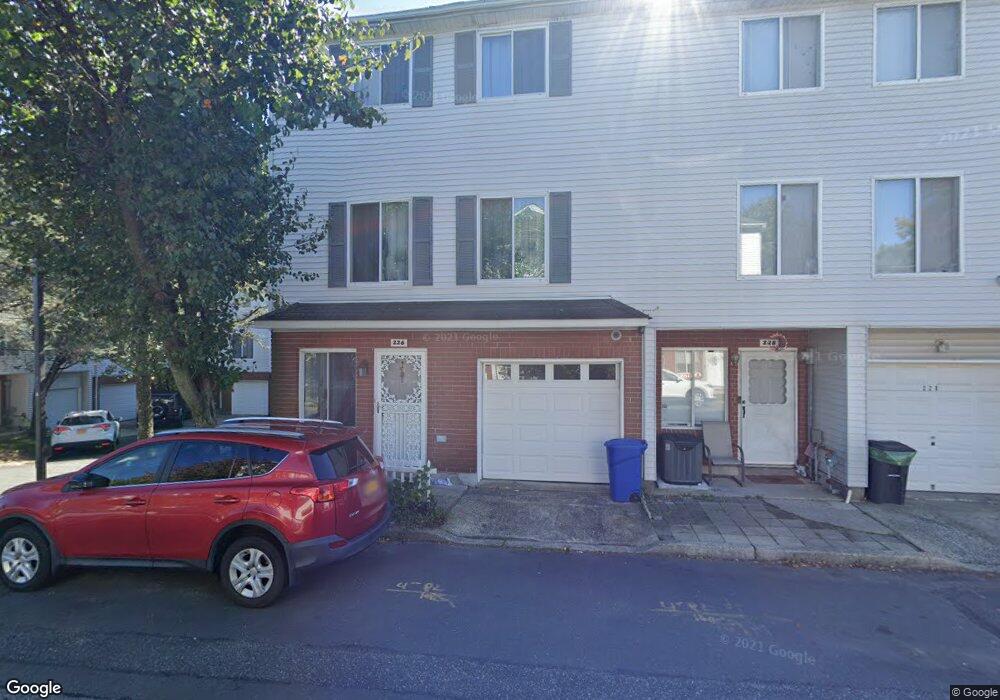
216 Ilyssa Way Unit 1 Staten Island, NY 10312
Arden Heights NeighborhoodEstimated Value: $518,000 - $568,972
3
Beds
3
Baths
1,510
Sq Ft
$366/Sq Ft
Est. Value
About This Home
This home is located at 216 Ilyssa Way Unit 1, Staten Island, NY 10312 and is currently estimated at $552,243, approximately $365 per square foot. 216 Ilyssa Way Unit 1 is a home located in Richmond County with nearby schools including P.S. 58R Space Shuttle Columbia School, I.S. 075 Frank D. Paulo, and Tottenville High School.
Ownership History
Date
Name
Owned For
Owner Type
Purchase Details
Closed on
May 6, 2019
Sold by
Rivas Jose A and Rivas Ma Kathleen Mae B
Bought by
Mourkous Onsy and Kalam Neven
Current Estimated Value
Home Financials for this Owner
Home Financials are based on the most recent Mortgage that was taken out on this home.
Original Mortgage
$340,000
Outstanding Balance
$298,322
Interest Rate
4.1%
Mortgage Type
New Conventional
Estimated Equity
$253,921
Purchase Details
Closed on
Sep 6, 2015
Sold by
Flores Alexandro and Flores Melinda
Bought by
Rivas Jose A and Rivas Ma Kathleen Mae B
Home Financials for this Owner
Home Financials are based on the most recent Mortgage that was taken out on this home.
Original Mortgage
$220,000
Interest Rate
3.87%
Mortgage Type
VA
Purchase Details
Closed on
Oct 30, 1998
Sold by
Aspen Knolls Corp
Bought by
Flores Alexandro and Flores Melinda
Create a Home Valuation Report for This Property
The Home Valuation Report is an in-depth analysis detailing your home's value as well as a comparison with similar homes in the area
Home Values in the Area
Average Home Value in this Area
Purchase History
| Date | Buyer | Sale Price | Title Company |
|---|---|---|---|
| Mourkous Onsy | $380,000 | Jewett Abstract Corp | |
| Rivas Jose A | $220,000 | None Available | |
| Flores Alexandro | $114,000 | Chicago Title Insurance Co |
Source: Public Records
Mortgage History
| Date | Status | Borrower | Loan Amount |
|---|---|---|---|
| Open | Mourkous Onsy | $340,000 | |
| Previous Owner | Rivas Jose A | $220,000 |
Source: Public Records
Tax History Compared to Growth
Tax History
| Year | Tax Paid | Tax Assessment Tax Assessment Total Assessment is a certain percentage of the fair market value that is determined by local assessors to be the total taxable value of land and additions on the property. | Land | Improvement |
|---|---|---|---|---|
| 2025 | $4,098 | $29,820 | $2,306 | $27,514 |
| 2024 | $4,098 | $25,140 | $2,581 | $22,559 |
| 2023 | $4,143 | $20,402 | $2,430 | $17,972 |
| 2022 | $4,042 | $24,660 | $3,180 | $21,480 |
| 2021 | $4,020 | $24,720 | $3,180 | $21,540 |
| 2020 | $4,724 | $23,940 | $3,180 | $20,760 |
| 2019 | $878 | $22,440 | $3,180 | $19,260 |
| 2018 | $867 | $17,002 | $2,650 | $14,352 |
| 2017 | $2,362 | $16,873 | $2,951 | $13,922 |
| 2016 | $2,173 | $15,919 | $2,981 | $12,938 |
| 2015 | $2,719 | $15,019 | $2,421 | $12,598 |
| 2014 | $2,719 | $14,169 | $2,504 | $11,665 |
Source: Public Records
Map
Nearby Homes
- 214 Ilyssa Way
- 192 Ilyssa Way
- 235 Ilyssa Way
- 247 Ilyssa Way
- 162 Ilyssa Way
- 287 Jamie Ln
- 78 Emily Ln
- 344 Ilyssa Way
- 400 Aspen Knolls Way Unit B2
- 355 Ilyssa Way
- 384 Aspen Knolls Way
- 439 Ilyssa Way
- 453 Ilyssa Way
- 70 Ilyssa Way
- 491 Ilyssa Way
- 60 Ilyssa Way
- 192 Jamie Ln
- 111 Gary St
- 270 Aspen Knolls Way
- 45 Ilyssa Way