216 Jr Blvd Macon, GA 31220
Estimated Value: $240,789 - $277,000
3
Beds
2
Baths
1,812
Sq Ft
$144/Sq Ft
Est. Value
About This Home
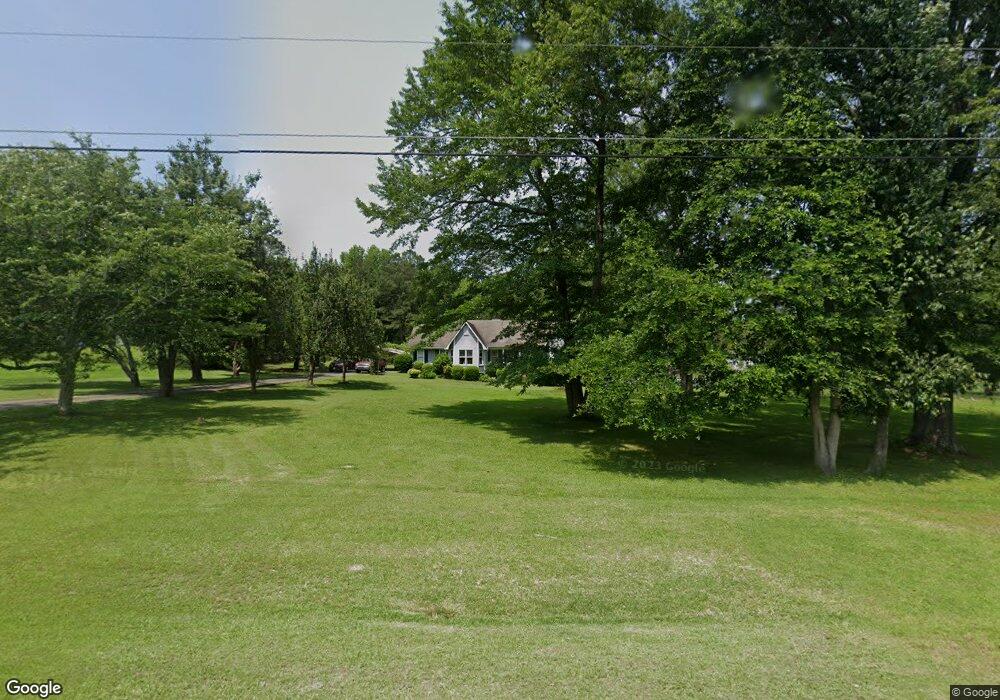
This home is located at 216 Jr Blvd, Macon, GA 31220 and is currently estimated at $261,697, approximately $144 per square foot. 216 Jr Blvd is a home located in Bibb County with nearby schools including Heritage Elementary School, Weaver Middle School, and Westside High School.
Ownership History
Date
Name
Owned For
Owner Type
Purchase Details
Closed on
Jul 15, 2024
Sold by
Ford Timmeth D
Bought by
Ford Rebecca S
Current Estimated Value
Purchase Details
Closed on
Aug 28, 2015
Sold by
Hunnicutt Victoria O
Bought by
Ford Rebecca and Ford Timmeth
Home Financials for this Owner
Home Financials are based on the most recent Mortgage that was taken out on this home.
Original Mortgage
$66,550
Interest Rate
4.16%
Purchase Details
Closed on
Aug 27, 2015
Sold by
Smith Victoria Q
Bought by
Hunnicutt Victoria O
Home Financials for this Owner
Home Financials are based on the most recent Mortgage that was taken out on this home.
Original Mortgage
$66,550
Interest Rate
4.16%
Purchase Details
Closed on
Jan 19, 2015
Sold by
Hunnicutt Victoria Oree
Bought by
Hunnicutt Victoria Oree and Hunnicutt William A
Purchase Details
Closed on
Jan 13, 2004
Bought by
Hunnicutt Victoria O
Create a Home Valuation Report for This Property
The Home Valuation Report is an in-depth analysis detailing your home's value as well as a comparison with similar homes in the area
Home Values in the Area
Average Home Value in this Area
Purchase History
| Date | Buyer | Sale Price | Title Company |
|---|---|---|---|
| Ford Rebecca S | $83,200 | None Listed On Document | |
| Ford Rebecca | $83,200 | -- | |
| Hunnicutt Victoria O | $83,200 | -- | |
| Hunnicutt Victoria Oree | -- | None Available | |
| Hunnicutt Victoria O | -- | -- |
Source: Public Records
Mortgage History
| Date | Status | Borrower | Loan Amount |
|---|---|---|---|
| Previous Owner | Ford Rebecca | $66,550 |
Source: Public Records
Tax History Compared to Growth
Tax History
| Year | Tax Paid | Tax Assessment Tax Assessment Total Assessment is a certain percentage of the fair market value that is determined by local assessors to be the total taxable value of land and additions on the property. | Land | Improvement |
|---|---|---|---|---|
| 2025 | $1,633 | $81,052 | $9,744 | $71,308 |
| 2024 | $1,649 | $79,392 | $9,744 | $69,648 |
| 2023 | $1,516 | $65,554 | $9,744 | $55,810 |
| 2022 | $1,359 | $53,147 | $6,894 | $46,253 |
| 2021 | $1,176 | $44,813 | $6,894 | $37,919 |
| 2020 | $1,202 | $44,813 | $6,894 | $37,919 |
| 2019 | $1,150 | $43,268 | $6,894 | $36,374 |
| 2018 | $1,941 | $43,268 | $6,894 | $36,374 |
| 2017 | $1,090 | $43,268 | $6,894 | $36,374 |
| 2016 | $997 | $43,268 | $6,894 | $36,374 |
| 2015 | $1,451 | $43,974 | $6,894 | $37,080 |
| 2014 | $1,451 | $43,974 | $6,894 | $37,080 |
Source: Public Records
Map
Nearby Homes
- 153 Montrose Dr
- 7359 Thomaston Rd
- 103 Dorchester Ct
- 508 Candlewick Ct
- 515 Candlewick Ct
- 933 Chisholm Trail
- 1390 Royalwyn Dr
- 1751 Bridle Ln
- 1776 Bridle
- 941 Galahad Cir
- 1698 Greentree Pkwy
- 1129 Santa fe Trail
- 1412 Johnson Rd
- 2037 Greentree Pkwy
- 1369 King Arthur Dr
- 1396 King Arthur Dr
- 637 Will Scarlet Way
- 1422 Trails End Dr
- 678 Will Scarlet Way
- 6591 Thomaston Rd