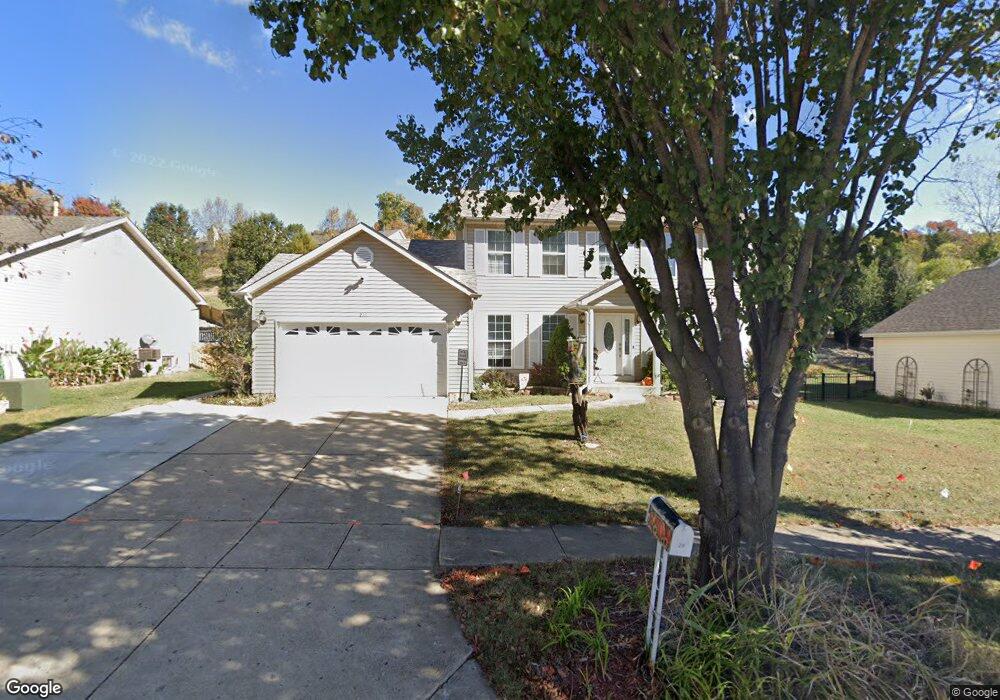
216 Keystone Dr Fenton, MO 63026
Estimated Value: $369,228 - $407,000
Studio
1
Bath
1,036
Sq Ft
$377/Sq Ft
Est. Value
About This Home
This home is located at 216 Keystone Dr, Fenton, MO 63026 and is currently estimated at $391,057, approximately $377 per square foot. 216 Keystone Dr is a home located in Jefferson County with nearby schools including George Guffey Elementary School, Ridgewood Middle School, and Fox Senior High School.
Ownership History
Date
Name
Owned For
Owner Type
Purchase Details
Closed on
Jun 22, 2004
Sold by
Ludwig Rebecca S
Bought by
Hamby Craig M and Hamby Heather S
Current Estimated Value
Home Financials for this Owner
Home Financials are based on the most recent Mortgage that was taken out on this home.
Original Mortgage
$152,000
Outstanding Balance
$73,055
Interest Rate
5.75%
Mortgage Type
Purchase Money Mortgage
Estimated Equity
$318,002
Purchase Details
Closed on
Nov 4, 1999
Sold by
Ludwig Timothy J
Bought by
Ludwig Rebecca S
Purchase Details
Closed on
Jan 23, 1998
Sold by
Charles F Vatterott Construction Co
Bought by
Ludwig Timothy J and Ludwig Rebecca S
Home Financials for this Owner
Home Financials are based on the most recent Mortgage that was taken out on this home.
Original Mortgage
$145,146
Interest Rate
7.5%
Mortgage Type
VA
Create a Home Valuation Report for This Property
The Home Valuation Report is an in-depth analysis detailing your home's value as well as a comparison with similar homes in the area
Home Values in the Area
Average Home Value in this Area
Purchase History
| Date | Buyer | Sale Price | Title Company |
|---|---|---|---|
| Hamby Craig M | -- | Old Republic Title Company | |
| Ludwig Rebecca S | -- | -- | |
| Ludwig Timothy J | -- | -- |
Source: Public Records
Mortgage History
| Date | Status | Borrower | Loan Amount |
|---|---|---|---|
| Open | Hamby Craig M | $152,000 | |
| Previous Owner | Ludwig Timothy J | $145,146 | |
| Closed | Hamby Craig M | $28,500 |
Source: Public Records
Tax History
| Year | Tax Paid | Tax Assessment Tax Assessment Total Assessment is a certain percentage of the fair market value that is determined by local assessors to be the total taxable value of land and additions on the property. | Land | Improvement |
|---|---|---|---|---|
| 2025 | $3,129 | $48,100 | $9,600 | $38,500 |
| 2024 | $3,129 | $42,700 | $7,700 | $35,000 |
| 2023 | $3,129 | $42,700 | $7,700 | $35,000 |
| 2022 | $2,921 | $39,800 | $4,800 | $35,000 |
| 2021 | $2,919 | $39,800 | $4,800 | $35,000 |
| 2020 | $2,750 | $35,300 | $4,200 | $31,100 |
| 2019 | $2,753 | $35,300 | $4,200 | $31,100 |
| 2018 | $2,714 | $34,900 | $4,200 | $30,700 |
| 2017 | $2,631 | $34,900 | $4,200 | $30,700 |
| 2016 | $2,447 | $32,600 | $4,000 | $28,600 |
Source: Public Records
Map
Nearby Homes
- 175 Keystone Dr
- 1053 Big Sky Dr
- 990 Hydeaway Ct
- 164 Hartford Ct
- 1137 Big Sky Dr
- 802 Fox Creek Dr
- 689 Fox Creek Dr
- 652 Green Jade Dr Unit H
- 651 Green Jade Dr Unit G
- 1 River Bend Dr
- 105 Lavernel Dr
- 60 Stonecliff Dr
- 819 Horizon Ln
- 414 Winding Bluffs Ct
- 316 Winding Bluffs Ct
- 711 Turnbridge Dr
- 831 Oak Dr
- 396 Winding Bluffs Ct
- 1519 Winding Meadows Dr
- 1527 Winding Meadows Dr
- 208 Keystone Dr
- 220 Keystone Dr
- 126 Winter Valley Dr
- 200 Keystone Dr
- 215 Keystone Dr
- 226 Keystone Dr
- 122 Winter Valley Dr
- 130 Winter Valley Dr
- 211 Keystone Dr
- 219 Keystone Dr
- 207 Keystone Dr
- 196 Keystone Dr
- 223 Keystone Dr
- 118 Winter Valley Dr
- 227 Keystone Dr
- 203 Keystone Dr
- 230 Keystone Dr
- 192 Keystone Dr
- 199 Keystone Dr
- 114 Winter Valley Dr
Your Personal Tour Guide
Ask me questions while you tour the home.