Estimated Value: $240,000 - $277,778
2
Beds
2
Baths
1,820
Sq Ft
$141/Sq Ft
Est. Value
About This Home
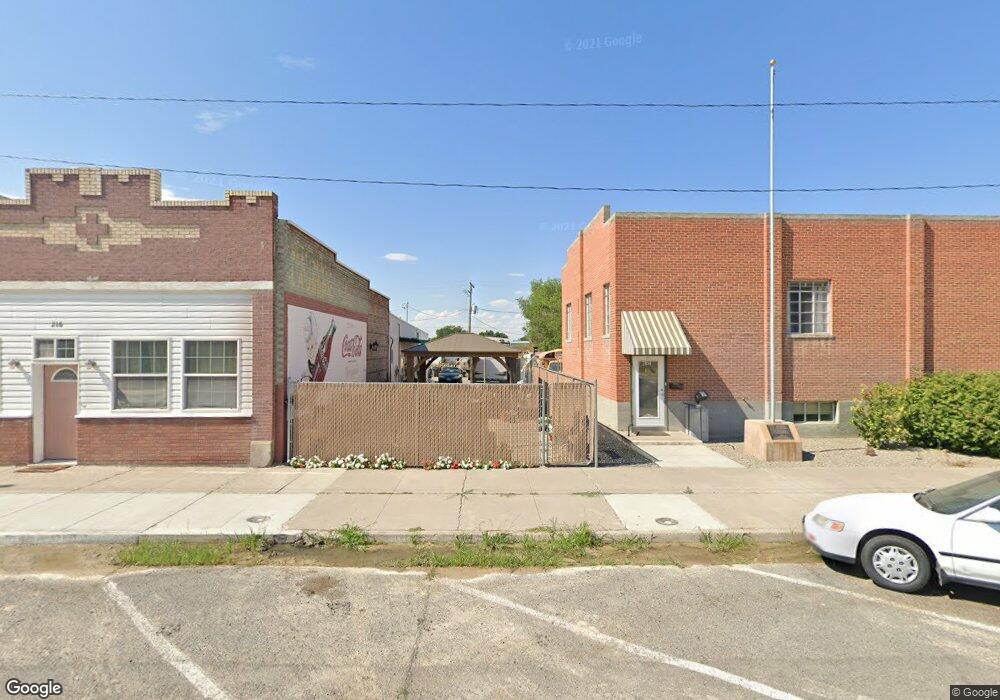
This home is located at 216 Main St Unit n/a, Buhl, ID 83316 and is currently estimated at $255,945, approximately $140 per square foot. 216 Main St Unit n/a is a home located in Twin Falls County with nearby schools including Filer Elementary School, Filer Intermediate School, and Filer Middle School.
Ownership History
Date
Name
Owned For
Owner Type
Purchase Details
Closed on
Dec 23, 2024
Sold by
Lineberry Joseph Richard and Lineberry Donna Jean
Bought by
Jess Zachary Tristen
Current Estimated Value
Home Financials for this Owner
Home Financials are based on the most recent Mortgage that was taken out on this home.
Original Mortgage
$8,925
Outstanding Balance
$4,004
Interest Rate
6.78%
Mortgage Type
FHA
Estimated Equity
$251,941
Purchase Details
Closed on
Oct 12, 2018
Sold by
Duvall Glen O and Duvall Kathy L
Bought by
Lineberry Joseph Richard and Lineberry Donna Jean
Home Financials for this Owner
Home Financials are based on the most recent Mortgage that was taken out on this home.
Original Mortgage
$52,500
Interest Rate
4.5%
Mortgage Type
New Conventional
Purchase Details
Closed on
Sep 19, 2013
Sold by
Duvall Glen O and Duvall Kathy L
Bought by
Duvall Glen O and Duvall Kahty L
Create a Home Valuation Report for This Property
The Home Valuation Report is an in-depth analysis detailing your home's value as well as a comparison with similar homes in the area
Home Values in the Area
Average Home Value in this Area
Purchase History
| Date | Buyer | Sale Price | Title Company |
|---|---|---|---|
| Jess Zachary Tristen | -- | Title One | |
| Jess Zachary Tristen | -- | Title One | |
| Lineberry Joseph Richard | -- | Title One | |
| Duvall Glen O | -- | None Available |
Source: Public Records
Mortgage History
| Date | Status | Borrower | Loan Amount |
|---|---|---|---|
| Open | Jess Zachary Tristen | $8,925 | |
| Closed | Jess Zachary Tristen | $8,925 | |
| Open | Jess Zachary Tristen | $250,381 | |
| Closed | Jess Zachary Tristen | $250,381 | |
| Previous Owner | Lineberry Joseph Richard | $52,500 |
Source: Public Records
Tax History Compared to Growth
Tax History
| Year | Tax Paid | Tax Assessment Tax Assessment Total Assessment is a certain percentage of the fair market value that is determined by local assessors to be the total taxable value of land and additions on the property. | Land | Improvement |
|---|---|---|---|---|
| 2025 | $3,040 | $250,377 | $56,760 | $193,617 |
| 2024 | $3,040 | $250,377 | $56,760 | $193,617 |
| 2023 | $3,354 | $269,466 | $56,760 | $212,706 |
| 2022 | $3,422 | $252,782 | $40,076 | $212,706 |
| 2021 | $3,181 | $184,675 | $26,680 | $157,995 |
| 2020 | $3,194 | $165,435 | $24,645 | $140,790 |
| 2019 | $3,291 | $154,703 | $16,298 | $138,405 |
| 2018 | $2,894 | $131,753 | $16,298 | $115,455 |
| 2017 | $2,642 | $116,597 | $16,298 | $100,299 |
| 2016 | $2,370 | $97,557 | $0 | $0 |
| 2015 | -- | $97,557 | $16,298 | $81,259 |
Source: Public Records
Map
Nearby Homes
- 216 Main St
- 214 Main St
- 219 Main St
- 215 W Midway St
- 205 W Midway St
- 229 W Midway St
- 229 Main St
- 130 Main St
- Lot 11 Block 2
- 3900 N Hwy 30
- 4328 N 3575 E
- 2488 N Triple Crown Rd
- 2490 N Triple Crown Rd
- 3742 N Gallent Fox Cir
- 3736 N Gallent Fox Cir
- 3738 N Gallent Fox Cir
- 3732 N Gallent Fox Cir
- 3737 N Gallent Fox Cir
- 3733 N Allie Ln
- 2478 N Triple Crown Rd