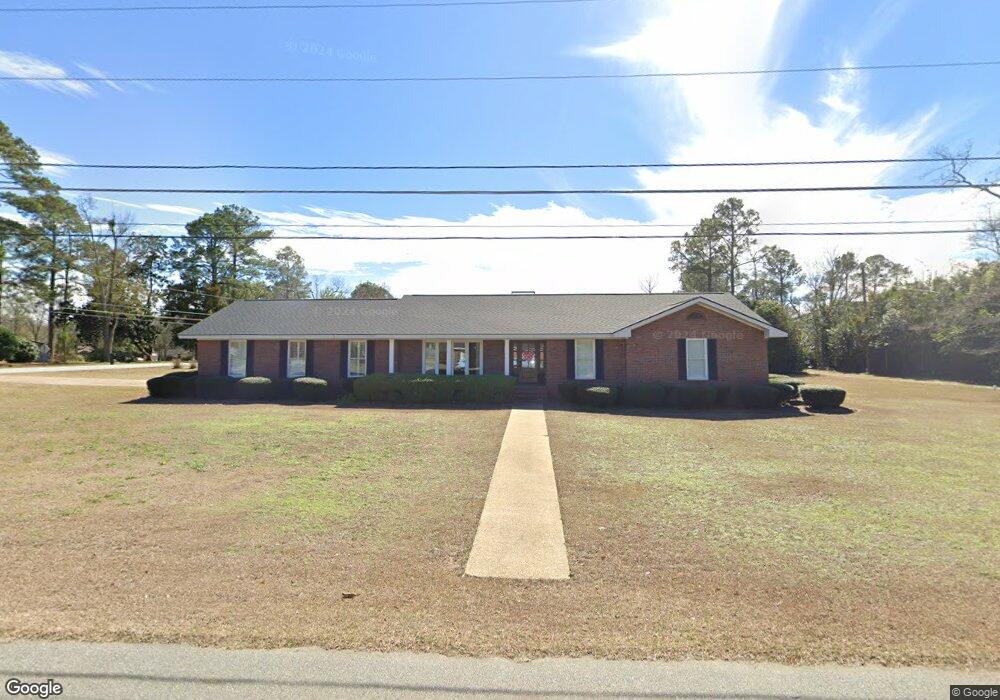
216 Main St Camilla, GA 31730
Estimated Value: $183,071 - $303,000
--
Bed
1
Bath
2,072
Sq Ft
$109/Sq Ft
Est. Value
About This Home
This home is located at 216 Main St, Camilla, GA 31730 and is currently estimated at $226,518, approximately $109 per square foot. 216 Main St is a home located in Mitchell County with nearby schools including Mitchell County Primary School, Mitchell County Elementary School, and Mitchell County Middle School.
Ownership History
Date
Name
Owned For
Owner Type
Purchase Details
Closed on
Mar 15, 2021
Sold by
Paul Roxanne T
Bought by
Rose Charles Tyler and Rose Elizabeth B
Current Estimated Value
Home Financials for this Owner
Home Financials are based on the most recent Mortgage that was taken out on this home.
Original Mortgage
$106,400
Outstanding Balance
$95,428
Interest Rate
2.73%
Mortgage Type
New Conventional
Estimated Equity
$131,090
Purchase Details
Closed on
Jun 19, 2017
Sold by
Tyus Rebecca W
Bought by
Tyus Family Irrevocable Trust
Purchase Details
Closed on
Jun 16, 2017
Sold by
Tyus Howard E
Bought by
Tyus Rebecca W
Create a Home Valuation Report for This Property
The Home Valuation Report is an in-depth analysis detailing your home's value as well as a comparison with similar homes in the area
Home Values in the Area
Average Home Value in this Area
Purchase History
| Date | Buyer | Sale Price | Title Company |
|---|---|---|---|
| Rose Charles Tyler | $133,000 | -- | |
| Tyus Family Irrevocable Trust | -- | -- | |
| Tyus Rebecca W | -- | -- |
Source: Public Records
Mortgage History
| Date | Status | Borrower | Loan Amount |
|---|---|---|---|
| Open | Rose Charles Tyler | $106,400 |
Source: Public Records
Tax History Compared to Growth
Tax History
| Year | Tax Paid | Tax Assessment Tax Assessment Total Assessment is a certain percentage of the fair market value that is determined by local assessors to be the total taxable value of land and additions on the property. | Land | Improvement |
|---|---|---|---|---|
| 2024 | $2,655 | $67,604 | $3,440 | $64,164 |
| 2023 | $2,842 | $67,604 | $3,440 | $64,164 |
| 2022 | $2,186 | $52,004 | $3,440 | $48,564 |
| 2021 | $1,728 | $46,724 | $3,440 | $43,284 |
| 2020 | $1,728 | $46,724 | $3,440 | $43,284 |
| 2019 | $1,722 | $46,724 | $3,440 | $43,284 |
| 2018 | $2,039 | $46,747 | $3,463 | $43,284 |
| 2017 | $1,818 | $47,664 | $3,463 | $44,201 |
| 2016 | $1,796 | $47,664 | $3,463 | $44,201 |
| 2015 | $1,796 | $47,664 | $3,463 | $44,201 |
| 2014 | $1,796 | $47,664 | $3,463 | $44,201 |
| 2013 | $1,796 | $47,664 | $3,463 | $44,200 |
Source: Public Records
Map
Nearby Homes