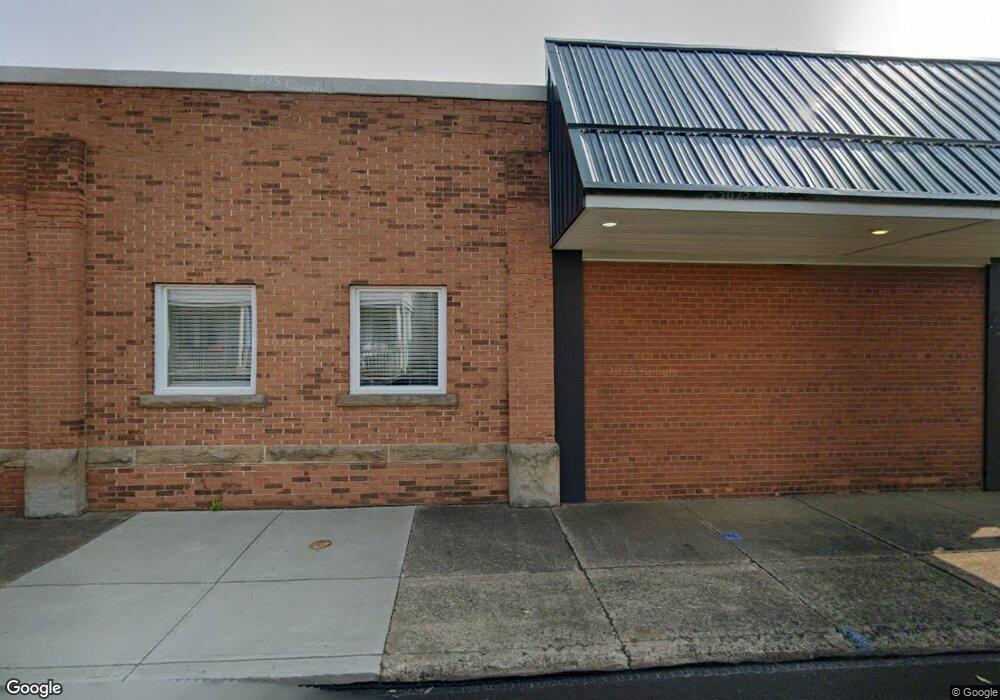
216 Main St Conneaut, OH 44030
Estimated Value: $475,171
--
Bed
--
Bath
13,238
Sq Ft
$36/Sq Ft
Est. Value
About This Home
This home is located at 216 Main St, Conneaut, OH 44030 and is currently estimated at $475,171, approximately $35 per square foot. 216 Main St is a home located in Ashtabula County with nearby schools including Lakeshore Primary Elementary School, Gateway Elementary School, and Conneaut Middle School.
Ownership History
Date
Name
Owned For
Owner Type
Purchase Details
Closed on
Jan 11, 2017
Sold by
Schwartz Rueben and Schwartz Kimberly M
Bought by
R & E Growth Properties Ltd
Current Estimated Value
Purchase Details
Closed on
Nov 21, 2015
Sold by
The City Of Conneaut
Bought by
Schwartz Construction Ltd
Purchase Details
Closed on
Feb 4, 2015
Sold by
The Ashtabula County Land Reutilization
Bought by
City Hall Hlag
Purchase Details
Closed on
Jan 29, 2015
Sold by
Heinonen Enterprises Inc
Bought by
Ashtabula County Land Reutilization Corp
Create a Home Valuation Report for This Property
The Home Valuation Report is an in-depth analysis detailing your home's value as well as a comparison with similar homes in the area
Home Values in the Area
Average Home Value in this Area
Purchase History
| Date | Buyer | Sale Price | Title Company |
|---|---|---|---|
| R & E Growth Properties Ltd | -- | None Available | |
| Schwartz Ruben | -- | None Available | |
| Schwartz Construction Ltd | -- | None Available | |
| City Hall Hlag | -- | None Available | |
| Ashtabula County Land Reutilization Corp | -- | None Available |
Source: Public Records
Tax History Compared to Growth
Tax History
| Year | Tax Paid | Tax Assessment Tax Assessment Total Assessment is a certain percentage of the fair market value that is determined by local assessors to be the total taxable value of land and additions on the property. | Land | Improvement |
|---|---|---|---|---|
| 2024 | $8,450 | $115,510 | $4,590 | $110,920 |
| 2023 | $7,176 | $115,510 | $4,590 | $110,920 |
| 2022 | $7,367 | $115,510 | $4,590 | $110,920 |
| 2021 | $3,765 | $58,000 | $4,590 | $53,410 |
| 2020 | $3,775 | $58,000 | $4,590 | $53,410 |
| 2019 | $3,444 | $53,490 | $4,660 | $48,830 |
| 2018 | $3,306 | $53,490 | $4,660 | $48,830 |
| 2017 | $1,955 | $31,860 | $4,940 | $26,920 |
| 2016 | $5 | $31,860 | $4,940 | $26,920 |
| 2015 | $23,041 | $31,860 | $4,940 | $26,920 |
| 2014 | $23,041 | $31,860 | $4,940 | $26,920 |
| 2013 | $20,642 | $31,260 | $4,380 | $26,880 |
Source: Public Records
Map
Nearby Homes