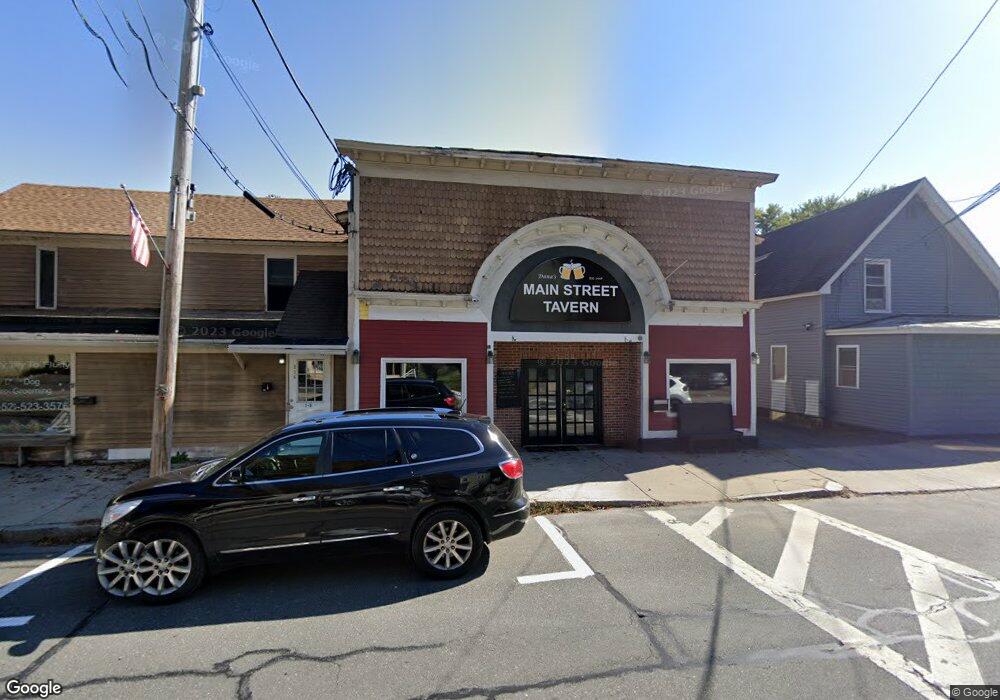
216 Main St Monson, MA 01057
Estimated Value: $833,712
--
Bed
--
Bath
8,260
Sq Ft
$101/Sq Ft
Est. Value
About This Home
This home is located at 216 Main St, Monson, MA 01057 and is currently estimated at $833,712, approximately $100 per square foot. 216 Main St is a home located in Hampden County with nearby schools including Quarry Hill Community School, Granite Valley School, and Monson High School.
Ownership History
Date
Name
Owned For
Owner Type
Purchase Details
Closed on
Apr 25, 2017
Sold by
Malloy Kevin and Malloy Holly
Bought by
Silktree Properties Ll
Current Estimated Value
Purchase Details
Closed on
Sep 20, 2002
Sold by
Kertenis John P and Kertenis Scott A
Bought by
Malloy Kevin and Malloy Holly
Purchase Details
Closed on
Nov 15, 1995
Sold by
Kelley Michael G and Kelley Barbara J
Bought by
Kertenis John P and Kertenis Scott A
Create a Home Valuation Report for This Property
The Home Valuation Report is an in-depth analysis detailing your home's value as well as a comparison with similar homes in the area
Home Values in the Area
Average Home Value in this Area
Purchase History
| Date | Buyer | Sale Price | Title Company |
|---|---|---|---|
| Silktree Properties Ll | $474,900 | -- | |
| Malloy Kevin | $315,000 | -- | |
| Kertenis John P | $247,500 | -- |
Source: Public Records
Tax History Compared to Growth
Tax History
| Year | Tax Paid | Tax Assessment Tax Assessment Total Assessment is a certain percentage of the fair market value that is determined by local assessors to be the total taxable value of land and additions on the property. | Land | Improvement |
|---|---|---|---|---|
| 2025 | $8,278 | $556,700 | $51,100 | $505,600 |
| 2024 | $8,069 | $520,600 | $51,100 | $469,500 |
| 2023 | $7,557 | $476,500 | $51,100 | $425,400 |
| 2022 | $7,783 | $436,500 | $51,100 | $385,400 |
| 2021 | $7,835 | $432,400 | $51,100 | $381,300 |
| 2020 | $7,900 | $432,400 | $51,100 | $381,300 |
| 2019 | $7,490 | $408,400 | $51,100 | $357,300 |
| 2018 | $6,961 | $395,500 | $56,700 | $338,800 |
| 2017 | $6,637 | $381,200 | $54,500 | $326,700 |
| 2016 | $6,617 | $386,500 | $54,600 | $331,900 |
| 2015 | $6,446 | $386,700 | $54,600 | $332,100 |
| 2014 | $6,265 | $386,700 | $54,600 | $332,100 |
Source: Public Records
Map
Nearby Homes