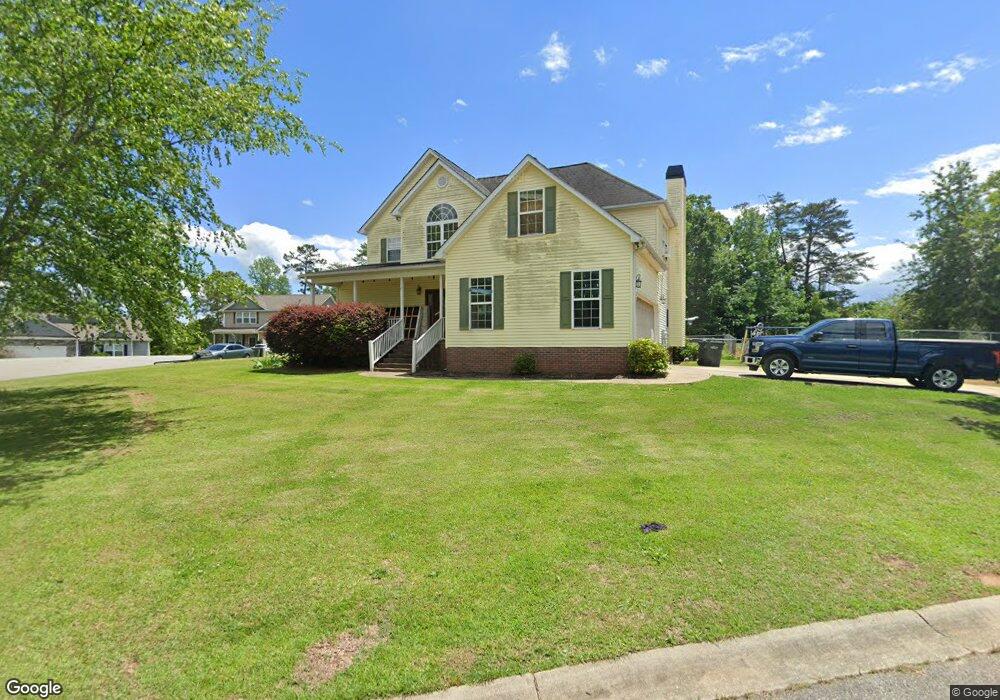
216 Morning Creek Dr Easley, SC 29640
Estimated Value: $391,000 - $421,953
6
Beds
4
Baths
3,200
Sq Ft
$127/Sq Ft
Est. Value
About This Home
This home is located at 216 Morning Creek Dr, Easley, SC 29640 and is currently estimated at $405,488, approximately $126 per square foot. 216 Morning Creek Dr is a home located in Pickens County with nearby schools including East End Elementary School, Richard H. Gettys Middle School, and Easley High School.
Ownership History
Date
Name
Owned For
Owner Type
Purchase Details
Closed on
May 4, 2016
Sold by
Hornsby Eddie and Hornsby Lynda
Bought by
Block Brian and Block Pamela
Current Estimated Value
Purchase Details
Closed on
Oct 25, 2006
Sold by
Sligh Wilmot
Bought by
Hornsby Eddie R and Hornsby Lynda L
Home Financials for this Owner
Home Financials are based on the most recent Mortgage that was taken out on this home.
Original Mortgage
$223,300
Interest Rate
6.39%
Mortgage Type
New Conventional
Purchase Details
Closed on
Sep 12, 2006
Sold by
Forest Wood Inc
Bought by
Sligh Wilmot
Home Financials for this Owner
Home Financials are based on the most recent Mortgage that was taken out on this home.
Original Mortgage
$223,300
Interest Rate
6.39%
Mortgage Type
New Conventional
Purchase Details
Closed on
Sep 20, 2005
Sold by
1St Capital Funding Inc
Bought by
Forest Woods Inc
Create a Home Valuation Report for This Property
The Home Valuation Report is an in-depth analysis detailing your home's value as well as a comparison with similar homes in the area
Home Values in the Area
Average Home Value in this Area
Purchase History
| Date | Buyer | Sale Price | Title Company |
|---|---|---|---|
| Block Brian | $230,000 | None Available | |
| Hornsby Eddie | -- | None Available | |
| Hornsby Eddie R | $220,000 | None Available | |
| Sligh Wilmot | -- | None Available | |
| Forest Woods Inc | -- | None Available |
Source: Public Records
Mortgage History
| Date | Status | Borrower | Loan Amount |
|---|---|---|---|
| Previous Owner | Hornsby Eddie R | $223,300 | |
| Previous Owner | Sligh Wilmot | $189,000 |
Source: Public Records
Tax History Compared to Growth
Tax History
| Year | Tax Paid | Tax Assessment Tax Assessment Total Assessment is a certain percentage of the fair market value that is determined by local assessors to be the total taxable value of land and additions on the property. | Land | Improvement |
|---|---|---|---|---|
| 2024 | $1,222 | $9,660 | $1,040 | $8,620 |
| 2023 | $1,222 | $9,660 | $1,040 | $8,620 |
| 2022 | $1,134 | $9,660 | $1,040 | $8,620 |
| 2021 | $1,119 | $9,660 | $1,040 | $8,620 |
| 2020 | $1,098 | $9,660 | $1,040 | $8,620 |
| 2019 | $1,107 | $9,660 | $1,040 | $8,620 |
| 2018 | $1,147 | $9,200 | $1,040 | $8,160 |
| 2017 | $1,064 | $9,200 | $1,040 | $8,160 |
| 2015 | $1,074 | $13,040 | $0 | $0 |
| 2008 | -- | $8,320 | $920 | $7,400 |
Source: Public Records
Map
Nearby Homes
- 0 Olive St
- 112 Heatherbrooke Ct
- 312 Morning Creek Dr
- 208 Holly Tree Ct
- 1177 Saluda Dam Rd
- 1120 Olive St
- 312 E Compass Way
- 129 W Compass Way
- 469 Anna Gray Cir
- 445 Anna Gray Cir
- 100 Oak Springs Ct
- 726 Saluda Dam Rd
- 547 Crest Dr
- 1412 Saluda Dam Rd
- 110 Couch St
- 00 Hagood and Powell St
- 115 Heathwood Rd
- 101 Powell St
- 203 Crescent St
- 00 NW Hagood and Powell St
- 106 Crepe Myrtle Ct
- 208 Morning Creek Dr
- 209 Morning Creek Dr
- 301 Morning Creek Dr
- 110 Crepe Myrtle Ct
- 204 Morning Creek Dr
- 101 Crepe Myrtle Ct
- 300 Morning Creek Dr
- 105 Crepe Myrtle Ct
- 100 Heatherbrooke Ct
- 109 Crepe Myrtle Ct
- 104 Heatherbrooke Ct
- 200 Morning Creek Dr
- 307 Morning Creek Dr
- 304 Morning Creek Dr
- 108 Heatherbrooke Ct
- 118 Morning Creek Dr
- 308 Morning Creek Dr
- 311 Morning Creek Dr
- 101 Heatherbrooke Ct