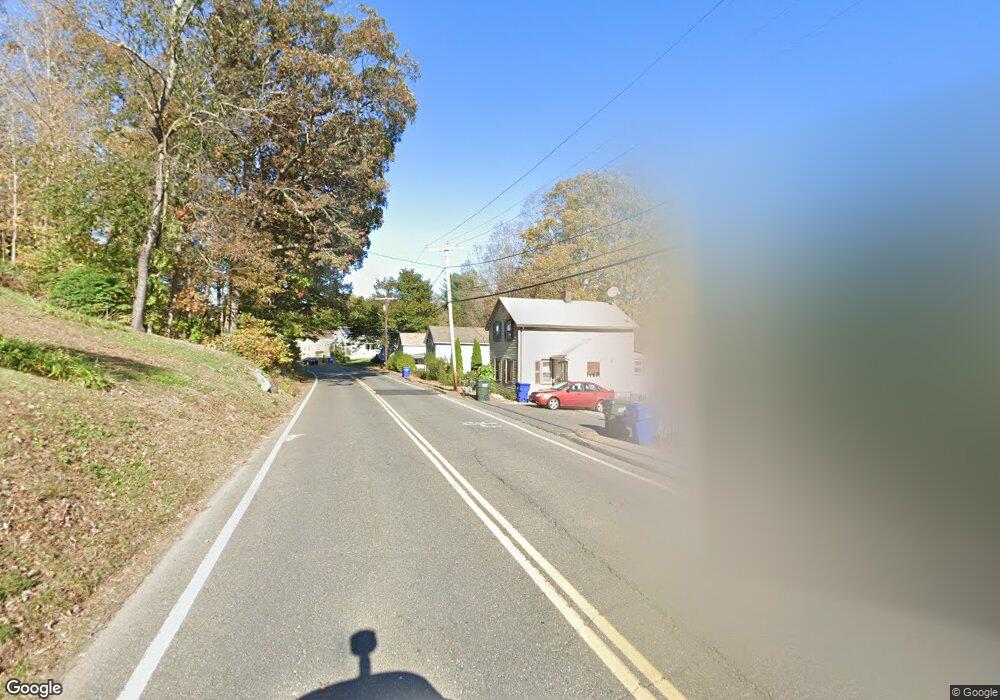
216 N Main St Thomaston, CT 06787
Estimated Value: $225,000 - $276,000
3
Beds
1
Bath
959
Sq Ft
$268/Sq Ft
Est. Value
About This Home
This home is located at 216 N Main St, Thomaston, CT 06787 and is currently estimated at $256,795, approximately $267 per square foot. 216 N Main St is a home located in Litchfield County with nearby schools including Black Rock School, Thomaston Center School, and Thomaston High School.
Ownership History
Date
Name
Owned For
Owner Type
Purchase Details
Closed on
Jul 7, 2010
Sold by
Parikh Maiti
Bought by
Adamson Martha
Current Estimated Value
Home Financials for this Owner
Home Financials are based on the most recent Mortgage that was taken out on this home.
Original Mortgage
$88,804
Outstanding Balance
$59,100
Interest Rate
4.75%
Mortgage Type
FHA
Estimated Equity
$197,695
Create a Home Valuation Report for This Property
The Home Valuation Report is an in-depth analysis detailing your home's value as well as a comparison with similar homes in the area
Home Values in the Area
Average Home Value in this Area
Purchase History
| Date | Buyer | Sale Price | Title Company |
|---|---|---|---|
| Adamson Martha | $90,000 | -- |
Source: Public Records
Mortgage History
| Date | Status | Borrower | Loan Amount |
|---|---|---|---|
| Open | Adamson Martha | $88,804 | |
| Previous Owner | Adamson Martha | $60,081 | |
| Previous Owner | Adamson Martha | $65,000 |
Source: Public Records
Tax History Compared to Growth
Tax History
| Year | Tax Paid | Tax Assessment Tax Assessment Total Assessment is a certain percentage of the fair market value that is determined by local assessors to be the total taxable value of land and additions on the property. | Land | Improvement |
|---|---|---|---|---|
| 2025 | $3,758 | $104,930 | $40,530 | $64,400 |
| 2024 | $3,605 | $104,930 | $40,530 | $64,400 |
| 2023 | $3,529 | $104,930 | $40,530 | $64,400 |
| 2022 | $3,369 | $104,930 | $40,530 | $64,400 |
| 2021 | $2,815 | $77,910 | $40,530 | $37,380 |
| 2020 | $2,815 | $77,910 | $40,530 | $37,380 |
| 2019 | $2,846 | $77,910 | $40,530 | $37,380 |
| 2018 | $2,803 | $78,330 | $40,530 | $37,800 |
| 2017 | $2,745 | $78,330 | $40,530 | $37,800 |
| 2016 | $2,862 | $84,000 | $38,570 | $45,430 |
| 2015 | $2,825 | $84,000 | $38,570 | $45,430 |
| 2014 | $2,825 | $84,000 | $38,570 | $45,430 |
Source: Public Records
Map
Nearby Homes