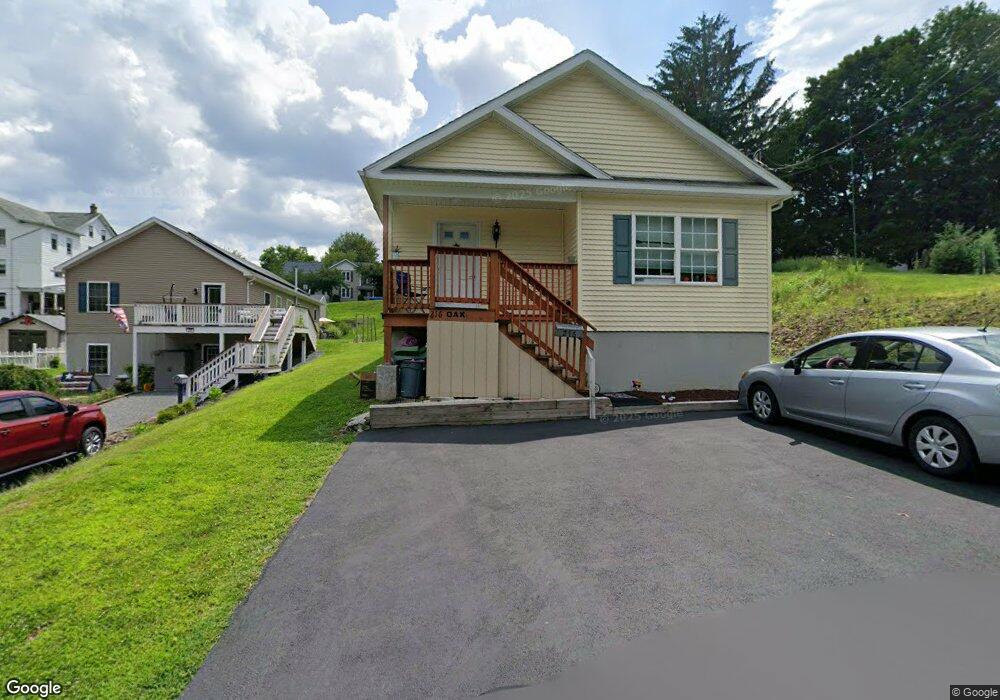
216 Oak St Jim Thorpe, PA 18229
Estimated Value: $188,000 - $323,000
3
Beds
2
Baths
1,304
Sq Ft
$215/Sq Ft
Est. Value
About This Home
This home is located at 216 Oak St, Jim Thorpe, PA 18229 and is currently estimated at $280,354, approximately $214 per square foot. 216 Oak St is a home with nearby schools including Jim Thorpe Area High School and Sts. Peter & Paul School.
Ownership History
Date
Name
Owned For
Owner Type
Purchase Details
Closed on
Nov 6, 2020
Sold by
Mason Realty Company
Bought by
Seman Sarah A
Current Estimated Value
Home Financials for this Owner
Home Financials are based on the most recent Mortgage that was taken out on this home.
Original Mortgage
$160,550
Outstanding Balance
$142,867
Interest Rate
2.8%
Mortgage Type
New Conventional
Estimated Equity
$137,487
Purchase Details
Closed on
Oct 25, 2010
Sold by
Stoffa Frank and Stoffa Carol
Bought by
Mason Realty Company
Create a Home Valuation Report for This Property
The Home Valuation Report is an in-depth analysis detailing your home's value as well as a comparison with similar homes in the area
Home Values in the Area
Average Home Value in this Area
Purchase History
| Date | Buyer | Sale Price | Title Company |
|---|---|---|---|
| Seman Sarah A | $169,000 | None Available | |
| Mason Realty Company | $40,000 | None Available |
Source: Public Records
Mortgage History
| Date | Status | Borrower | Loan Amount |
|---|---|---|---|
| Open | Seman Sarah A | $160,550 |
Source: Public Records
Tax History Compared to Growth
Tax History
| Year | Tax Paid | Tax Assessment Tax Assessment Total Assessment is a certain percentage of the fair market value that is determined by local assessors to be the total taxable value of land and additions on the property. | Land | Improvement |
|---|---|---|---|---|
| 2025 | $4,885 | $61,550 | $14,150 | $47,400 |
| 2024 | $4,701 | $61,550 | $14,150 | $47,400 |
| 2023 | $4,615 | $61,550 | $14,150 | $47,400 |
| 2022 | $1,044 | $14,150 | $14,150 | $0 |
| 2021 | $1,044 | $14,150 | $14,150 | $0 |
| 2020 | $1,008 | $14,150 | $14,150 | $0 |
| 2019 | $979 | $14,150 | $14,150 | $0 |
| 2018 | $958 | $14,150 | $14,150 | $0 |
| 2017 | $929 | $14,150 | $14,150 | $0 |
| 2016 | -- | $14,150 | $14,150 | $0 |
| 2015 | -- | $14,150 | $14,150 | $0 |
| 2014 | -- | $14,150 | $14,150 | $0 |
Source: Public Records
Map
Nearby Homes