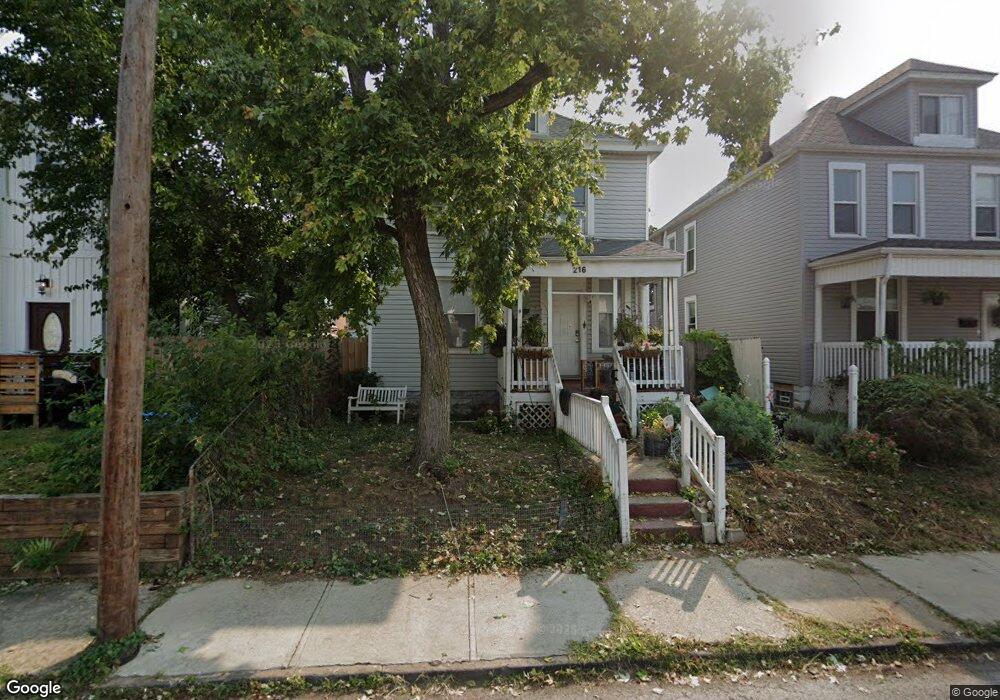
216 S Cypress Ave Columbus, OH 43223
Franklinton NeighborhoodEstimated Value: $197,000 - $252,000
3
Beds
2
Baths
1,442
Sq Ft
$157/Sq Ft
Est. Value
About This Home
This home is located at 216 S Cypress Ave, Columbus, OH 43223 and is currently estimated at $226,522, approximately $157 per square foot. 216 S Cypress Ave is a home located in Franklin County with nearby schools including Avondale Elementary School, Starling PK-8, and West High School.
Ownership History
Date
Name
Owned For
Owner Type
Purchase Details
Closed on
Mar 24, 2010
Sold by
Investors Home Marketing Llc
Bought by
U & I Prorerties Llc
Current Estimated Value
Purchase Details
Closed on
Apr 1, 2003
Sold by
Bank One Na
Bought by
Investors Home Marketing Llc
Home Financials for this Owner
Home Financials are based on the most recent Mortgage that was taken out on this home.
Original Mortgage
$52,000
Interest Rate
15%
Mortgage Type
Purchase Money Mortgage
Purchase Details
Closed on
Mar 3, 2003
Sold by
Cain Joi L and Case #01Cve01 495
Bought by
Bank One National Assn
Home Financials for this Owner
Home Financials are based on the most recent Mortgage that was taken out on this home.
Original Mortgage
$52,000
Interest Rate
15%
Mortgage Type
Purchase Money Mortgage
Purchase Details
Closed on
Dec 6, 1996
Sold by
Marchese Vincent J
Bought by
Joi L Cain
Home Financials for this Owner
Home Financials are based on the most recent Mortgage that was taken out on this home.
Original Mortgage
$38,658
Interest Rate
7.91%
Mortgage Type
FHA
Create a Home Valuation Report for This Property
The Home Valuation Report is an in-depth analysis detailing your home's value as well as a comparison with similar homes in the area
Home Values in the Area
Average Home Value in this Area
Purchase History
| Date | Buyer | Sale Price | Title Company |
|---|---|---|---|
| U & I Prorerties Llc | $18,000 | Independent | |
| Investors Home Marketing Llc | $24,000 | Resource Title Agency Inc | |
| Bank One National Assn | $30,600 | -- | |
| Joi L Cain | $39,900 | -- |
Source: Public Records
Mortgage History
| Date | Status | Borrower | Loan Amount |
|---|---|---|---|
| Previous Owner | Investors Home Marketing Llc | $52,000 | |
| Previous Owner | Joi L Cain | $38,658 |
Source: Public Records
Tax History Compared to Growth
Tax History
| Year | Tax Paid | Tax Assessment Tax Assessment Total Assessment is a certain percentage of the fair market value that is determined by local assessors to be the total taxable value of land and additions on the property. | Land | Improvement |
|---|---|---|---|---|
| 2024 | $2,671 | $58,280 | $6,440 | $51,840 |
| 2023 | $2,638 | $58,275 | $6,440 | $51,835 |
| 2022 | $1,325 | $24,930 | $1,230 | $23,700 |
| 2021 | $1,560 | $24,930 | $1,230 | $23,700 |
| 2020 | $1,329 | $24,930 | $1,230 | $23,700 |
| 2019 | $1,291 | $20,760 | $1,020 | $19,740 |
| 2018 | $1,098 | $20,760 | $1,020 | $19,740 |
| 2017 | $1,291 | $20,760 | $1,020 | $19,740 |
| 2016 | $997 | $14,670 | $1,440 | $13,230 |
| 2015 | $907 | $14,670 | $1,440 | $13,230 |
| 2014 | $910 | $14,670 | $1,440 | $13,230 |
| 2013 | $499 | $16,310 | $1,610 | $14,700 |
Source: Public Records
Map
Nearby Homes
- 211 Dakota Ave
- 273 Avondale Ave
- 286 Avondale Ave
- 1011 Sullivant Ave
- 345 Dakota Ave
- 351 Dakota Ave
- 278 S Yale Ave
- 186 Avondale Ave Unit 188
- 281 S Yale Ave
- 955 Sullivant Ave
- 221 S Yale Ave
- 112 S Cypress Ave
- 0 Campbell Ave
- 975 Campbell Ave Unit 975
- 293 W Park Ave Unit 295
- 148 W Park Ave
- 1082 Thomas Ave
- 323 W Park Ave
- 61 Dakota Ave
- 72 Avondale Ave
- 210 S Cypress Ave
- 222 S Cypress Ave
- 215 Dakota Ave Unit 217
- 4033 S Cypress Ave
- 0 S Cypress Ave
- 221 Dakota Ave
- 215-217 Dakota Ave
- 234 S Cypress Ave
- 203 Dakota Ave Unit 205
- 1055 W Rich St
- 196 S Cypress Ave
- 213-215 S Cypress Ave
- 213 S Cypress Ave Unit 215
- 217 S Cypress Ave
- 240 S Cypress Ave
- 209 S Cypress Ave
- 205 S Cypress Ave
- 193 Dakota Ave
- 201 S Cypress Ave
- 242 S Cypress Ave