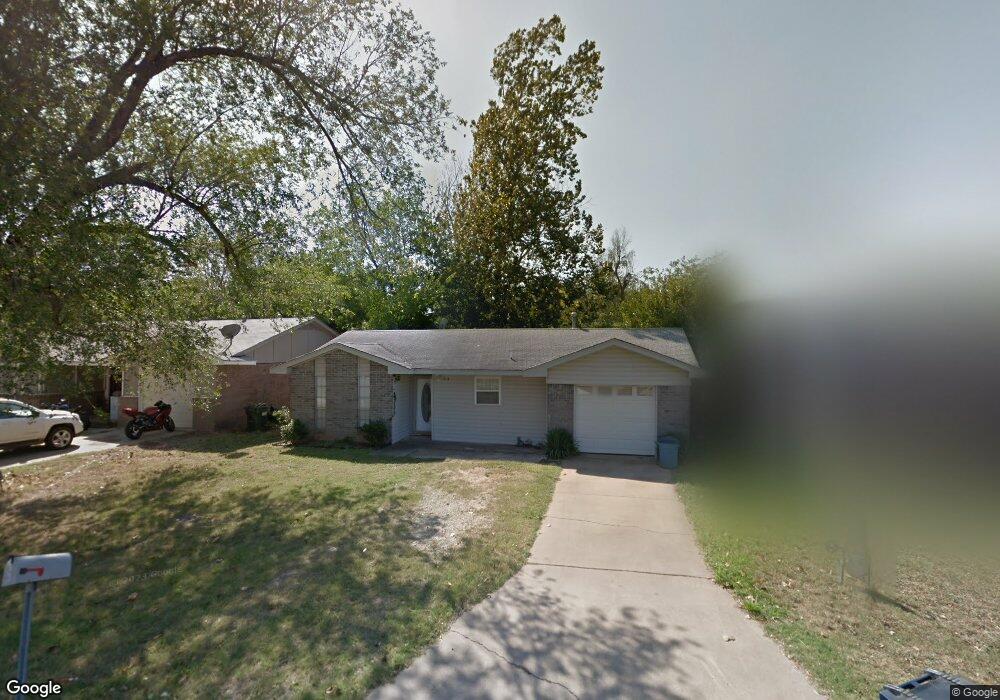
216 S Osage Ave Shawnee, OK 74801
Estimated Value: $81,000 - $106,000
2
Beds
1
Bath
918
Sq Ft
$103/Sq Ft
Est. Value
About This Home
This home is located at 216 S Osage Ave, Shawnee, OK 74801 and is currently estimated at $94,530, approximately $102 per square foot. 216 S Osage Ave is a home located in Pottawatomie County with nearby schools including Horace Mann Elementary School, Shawnee Middle School, and Shawnee High School.
Ownership History
Date
Name
Owned For
Owner Type
Purchase Details
Closed on
Jul 1, 2022
Sold by
Simmons Samuel J and Simmons Allison J
Bought by
Hensley Jeremy
Current Estimated Value
Home Financials for this Owner
Home Financials are based on the most recent Mortgage that was taken out on this home.
Original Mortgage
$73,641
Outstanding Balance
$70,157
Interest Rate
5.25%
Mortgage Type
FHA
Estimated Equity
$24,373
Purchase Details
Closed on
Apr 28, 2006
Sold by
Manion Joshua W and Manion Tennille A
Bought by
Glass Ronald
Home Financials for this Owner
Home Financials are based on the most recent Mortgage that was taken out on this home.
Original Mortgage
$53,061
Interest Rate
6.32%
Mortgage Type
Unknown
Purchase Details
Closed on
Aug 22, 2001
Sold by
Morton Regena and Morton Charles
Bought by
Manion Joshua and Manion Tenille
Purchase Details
Closed on
Oct 3, 1991
Sold by
Knight Neva
Bought by
Knight Neva and Morton Rege
Create a Home Valuation Report for This Property
The Home Valuation Report is an in-depth analysis detailing your home's value as well as a comparison with similar homes in the area
Home Values in the Area
Average Home Value in this Area
Purchase History
| Date | Buyer | Sale Price | Title Company |
|---|---|---|---|
| Hensley Jeremy | $75,000 | First American Title | |
| Glass Ronald | $52,000 | None Available | |
| Manion Joshua | $35,000 | -- | |
| Knight Neva | -- | -- |
Source: Public Records
Mortgage History
| Date | Status | Borrower | Loan Amount |
|---|---|---|---|
| Open | Hensley Jeremy | $73,641 | |
| Previous Owner | Glass Ronald | $53,061 |
Source: Public Records
Tax History Compared to Growth
Tax History
| Year | Tax Paid | Tax Assessment Tax Assessment Total Assessment is a certain percentage of the fair market value that is determined by local assessors to be the total taxable value of land and additions on the property. | Land | Improvement |
|---|---|---|---|---|
| 2024 | $836 | $9,270 | $540 | $8,730 |
| 2023 | $836 | $9,000 | $540 | $8,460 |
| 2022 | $638 | $7,217 | $540 | $6,677 |
| 2021 | $626 | $7,217 | $540 | $6,677 |
| 2020 | $628 | $7,217 | $540 | $6,677 |
| 2019 | $649 | $7,217 | $540 | $6,677 |
| 2018 | $619 | $7,046 | $540 | $6,506 |
| 2017 | $610 | $7,046 | $540 | $6,506 |
| 2016 | $608 | $6,961 | $540 | $6,421 |
| 2015 | $596 | $6,958 | $540 | $6,418 |
| 2014 | $596 | $6,960 | $540 | $6,420 |
Source: Public Records
Map
Nearby Homes
- 121 S Center Ave
- 209 S Ruth Ave
- 1600 E Farrall
- 1330 E Main St
- 1201 E Main St
- 209 S Eden Ave
- 124 N Pesotum Ave
- 201 S Dixon Ave
- 1015 E Main St
- 1328 E 10th St
- 1326 E 10th St
- 1127 E 10th St
- 322 N Draper Ave
- 210 N Roosevelt Ave
- 1119 E 11th St
- 1103 E 11th St
- 1330 E Whittaker St
- 915 E Whittaker St
- 321 N Mckinley Ave
- 418 S Penn Ave
- 214 S Osage Ave
- 218 S Osage Ave
- 220 S Osage Ave
- 225 S Draper Ave
- 223 S Draper Ave
- 229 S Draper Ave
- 221 S Draper Ave
- 215 S Osage Ave
- 210 S Osage Ave
- 222 S Osage Ave
- 233 S Draper Ave
- 219 S Draper Ave
- 211 S Osage Ave
- 208 S Osage Ave
- 237 S Draper Ave
- 217 S Draper Ave
- 302 S Osage Ave
- 225 S Osage Ave
- 215 S Draper Ave
- 209 S Osage Ave