Estimated Value: $312,619 - $331,000
3
Beds
2
Baths
1,861
Sq Ft
$173/Sq Ft
Est. Value
About This Home
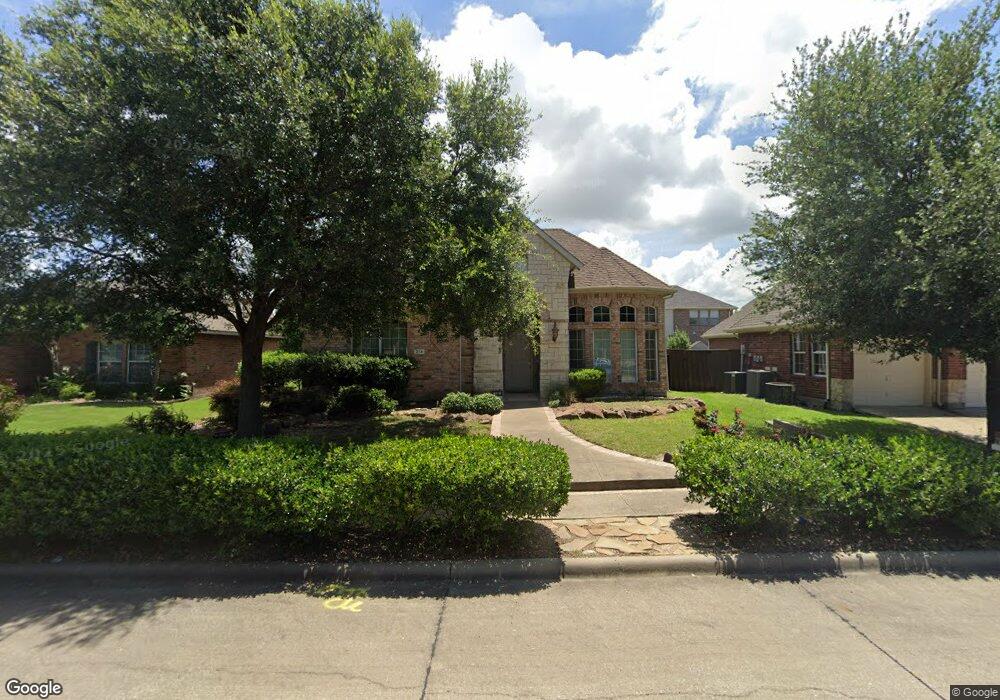
This home is located at 216 San Jacinto Dr, Lavon, TX 75166 and is currently estimated at $322,155, approximately $173 per square foot. 216 San Jacinto Dr is a home located in Collin County with nearby schools including Nesmith Elementary School, Community High School, and Wylie Preparatory Academy.
Ownership History
Date
Name
Owned For
Owner Type
Purchase Details
Closed on
May 3, 2011
Sold by
Lennar Homes Of Texas Sales & Marketing
Bought by
Harrison Leticia A
Current Estimated Value
Home Financials for this Owner
Home Financials are based on the most recent Mortgage that was taken out on this home.
Original Mortgage
$150,259
Outstanding Balance
$104,327
Interest Rate
4.86%
Estimated Equity
$217,828
Purchase Details
Closed on
May 4, 2010
Sold by
Bowen Family Homes Of Texas Inc
Bought by
Caswell Acquisition Group Llc
Purchase Details
Closed on
May 18, 2006
Sold by
Bear Creek Residential Lp
Bought by
Bowen Family Homes Of Texas Inc
Home Financials for this Owner
Home Financials are based on the most recent Mortgage that was taken out on this home.
Original Mortgage
$316,800
Interest Rate
6.5%
Mortgage Type
Construction
Create a Home Valuation Report for This Property
The Home Valuation Report is an in-depth analysis detailing your home's value as well as a comparison with similar homes in the area
Home Values in the Area
Average Home Value in this Area
Purchase History
| Date | Buyer | Sale Price | Title Company |
|---|---|---|---|
| Harrison Leticia A | -- | Natgf | |
| Lennar Homes Of Texas Sales & Marketing | -- | Natgf | |
| Caswell Acquisition Group Llc | $115,000 | None Available | |
| Bowen Family Homes Of Texas Inc | -- | None Available |
Source: Public Records
Mortgage History
| Date | Status | Borrower | Loan Amount |
|---|---|---|---|
| Open | Harrison Leticia A | $150,259 | |
| Previous Owner | Bowen Family Homes Of Texas Inc | $316,800 |
Source: Public Records
Tax History Compared to Growth
Tax History
| Year | Tax Paid | Tax Assessment Tax Assessment Total Assessment is a certain percentage of the fair market value that is determined by local assessors to be the total taxable value of land and additions on the property. | Land | Improvement |
|---|---|---|---|---|
| 2025 | $5,244 | $310,643 | $85,000 | $225,643 |
| 2024 | $5,244 | $311,625 | $85,000 | $223,000 |
| 2023 | $5,244 | $283,295 | $85,000 | $248,510 |
| 2022 | $5,425 | $257,541 | $70,000 | $220,000 |
| 2021 | $5,124 | $234,128 | $55,000 | $179,128 |
| 2020 | $5,214 | $226,340 | $55,000 | $171,340 |
| 2019 | $5,386 | $225,580 | $55,000 | $170,580 |
| 2018 | $4,960 | $210,813 | $55,000 | $155,813 |
| 2017 | $4,726 | $202,524 | $55,000 | $147,524 |
| 2016 | $4,328 | $186,598 | $40,000 | $146,598 |
| 2015 | $3,298 | $179,676 | $35,000 | $144,676 |
Source: Public Records
Map
Nearby Homes
- 682 Crockett Dr
- 638 Bonham Dr
- Seaberry Plan at Bear Creek at Grand Heritage - Bear Creek Classic 60
- Willow Plan at Bear Creek at Grand Heritage - Bear Creek Elements
- Dogwood III Plan at Bear Creek at Grand Heritage - Bear Creek Classic 50
- Magnolia Plan at Bear Creek at Grand Heritage - Bear Creek Classic 60
- Woodrose Plan at Bear Creek at Grand Heritage - Bear Creek Elements
- Cypress II Plan at Bear Creek at Grand Heritage - Bear Creek Classic 60
- Kirlin Plan at Bear Creek at Grand Heritage
- Rose III Plan at Bear Creek at Grand Heritage - Bear Creek Classic 60
- Portico Plan at Bear Creek at Grand Heritage
- Rose Plan at Bear Creek at Grand Heritage - Bear Creek Classic 60
- Magnolia II Plan at Bear Creek at Grand Heritage - Bear Creek Classic 60
- Carolina II Plan at Bear Creek at Grand Heritage - Bear Creek Classic 50
- Hawthorne Plan at Bear Creek at Grand Heritage - Bear Creek Classic 60
- Magnolia III Plan at Bear Creek at Grand Heritage - Bear Creek Classic 50
- Carolina III Plan at Bear Creek at Grand Heritage - Bear Creek Classic 60
- Bellflower Plan at Bear Creek at Grand Heritage - Bear Creek Classic 60
- Carolina IV Plan at Bear Creek at Grand Heritage - Bear Creek Classic 50
- Spring Cress Plan at Bear Creek at Grand Heritage - Bear Creek Classic 60
- 226 San Jacinto Dr
- 232 San Jacinto Dr
- 223 Childress Dr
- 701 Austin Ln
- 231 Childress Dr
- 240 San Jacinto Dr
- 712 Austin Ln
- 708 Austin Ln
- 716 Austin Ln
- 257 Childress Dr
- 704 Austin Ln
- 693 Austin Ln
- 256 San Jacinto Dr
- 700 Austin Ln
- 692 Bonham Dr
- 269 Childress Dr
- 698 Austin Ln
- 263 San Jacinto Dr
- 687 Austin Ln
- 686 Bonham Dr