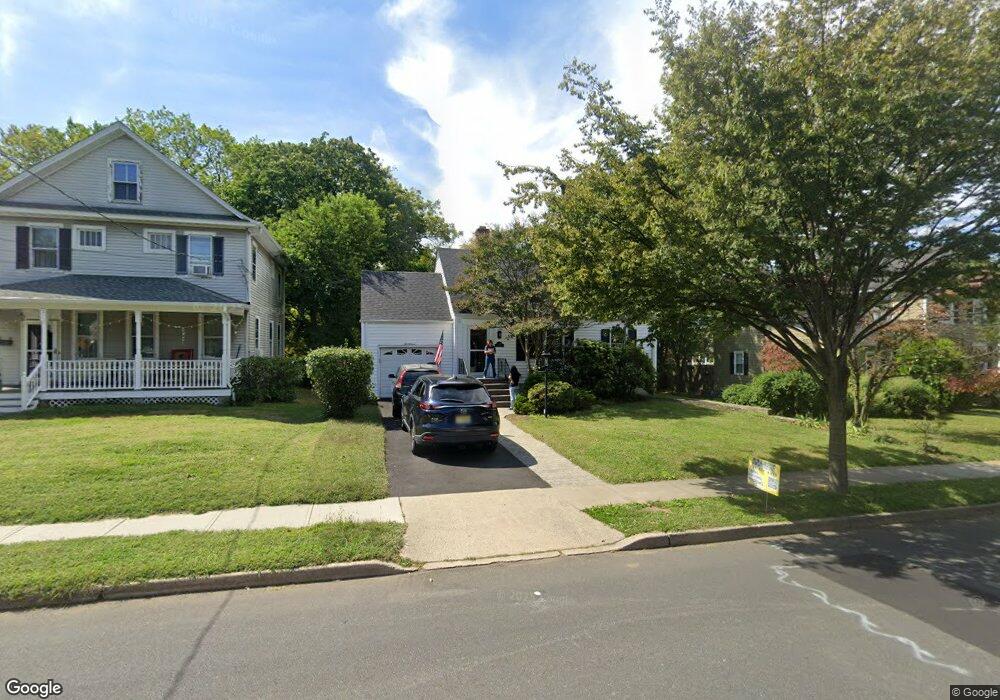
216 Spring St Red Bank, NJ 07701
Estimated Value: $763,877 - $840,000
3
Beds
2
Baths
1,856
Sq Ft
$425/Sq Ft
Est. Value
About This Home
This home is located at 216 Spring St, Red Bank, NJ 07701 and is currently estimated at $789,219, approximately $425 per square foot. 216 Spring St is a home located in Monmouth County with nearby schools including Red Bank Primary School, Red Bank Middle School, and Red Bank Regional High School.
Ownership History
Date
Name
Owned For
Owner Type
Purchase Details
Closed on
Nov 29, 2010
Sold by
Jackson Lynn and Senion Gerald
Bought by
Bopp Brian Joseph and Bopp Lisa Marie
Current Estimated Value
Home Financials for this Owner
Home Financials are based on the most recent Mortgage that was taken out on this home.
Original Mortgage
$371,341
Outstanding Balance
$245,712
Interest Rate
4.25%
Mortgage Type
FHA
Estimated Equity
$543,507
Purchase Details
Closed on
May 9, 2009
Sold by
Jackson Lynn J and Senion Charles E
Bought by
Senion Gerald C and Jackson Lynn J
Create a Home Valuation Report for This Property
The Home Valuation Report is an in-depth analysis detailing your home's value as well as a comparison with similar homes in the area
Home Values in the Area
Average Home Value in this Area
Purchase History
| Date | Buyer | Sale Price | Title Company |
|---|---|---|---|
| Bopp Brian Joseph | $190,875 | None Available | |
| Senion Gerald C | -- | None Available |
Source: Public Records
Mortgage History
| Date | Status | Borrower | Loan Amount |
|---|---|---|---|
| Open | Bopp Brian Joseph | $371,341 |
Source: Public Records
Tax History Compared to Growth
Tax History
| Year | Tax Paid | Tax Assessment Tax Assessment Total Assessment is a certain percentage of the fair market value that is determined by local assessors to be the total taxable value of land and additions on the property. | Land | Improvement |
|---|---|---|---|---|
| 2025 | $10,928 | $678,700 | $423,300 | $255,400 |
| 2024 | $10,554 | $578,500 | $333,300 | $245,200 |
| 2023 | $10,554 | $552,300 | $333,300 | $219,000 |
| 2022 | $9,738 | $490,700 | $281,100 | $209,600 |
| 2021 | $9,738 | $435,300 | $244,400 | $190,900 |
| 2020 | $9,511 | $418,600 | $244,400 | $174,200 |
| 2019 | $9,140 | $413,400 | $244,400 | $169,000 |
| 2018 | $8,903 | $407,100 | $244,400 | $162,700 |
| 2017 | $8,569 | $406,100 | $244,400 | $161,700 |
| 2016 | $7,828 | $371,500 | $214,000 | $157,500 |
| 2015 | $8,167 | $401,700 | $262,400 | $139,300 |
| 2014 | $8,580 | $448,500 | $294,000 | $154,500 |
Source: Public Records
Map
Nearby Homes
- 283 Spring St Unit 1C
- 4 Manor Dr
- 61 Tower Hill Dr Unit 708
- 83 Tower Hill Dr
- 58 Hudson Ave
- 70 Hudson Ave
- 82 Linden Place
- 44 Hudson Ave
- 48 Hudson Ave
- 69 Washington St
- 81 Pinckney Rd
- 65 Washington St
- 17 Leroy Place Unit 1A
- 17 Leroy Place Unit 2B
- 30 Crest Dr
- 23 Wallace St Unit 306
- 21 Washington St
- 40 Worthley St
- 59 Leroy Place
- 32 Woodbine Ave
- 220 Spring St
- 43 Tower Hill Ave Unit 2
- 43 Tower Hill Ave Unit 1
- 224 Spring St
- 31 Tower Hill Ave
- 228 Spring St
- 228 Spring St Unit Upstairs
- 2283 Spring St Unit 1B
- 219 Spring St
- 221 Spring St
- 51 Tower Hill Ave
- 27 Tower Hill Ave
- 40 Tower Hill Ave
- 38 Tower Hill Ave
- 232 Spring St
- 36 Tower Hill Ave
- 23 Tower Hill Ave
- 229 Spring St
- 52 Tower Hill Ave
- 8 Highland Ave