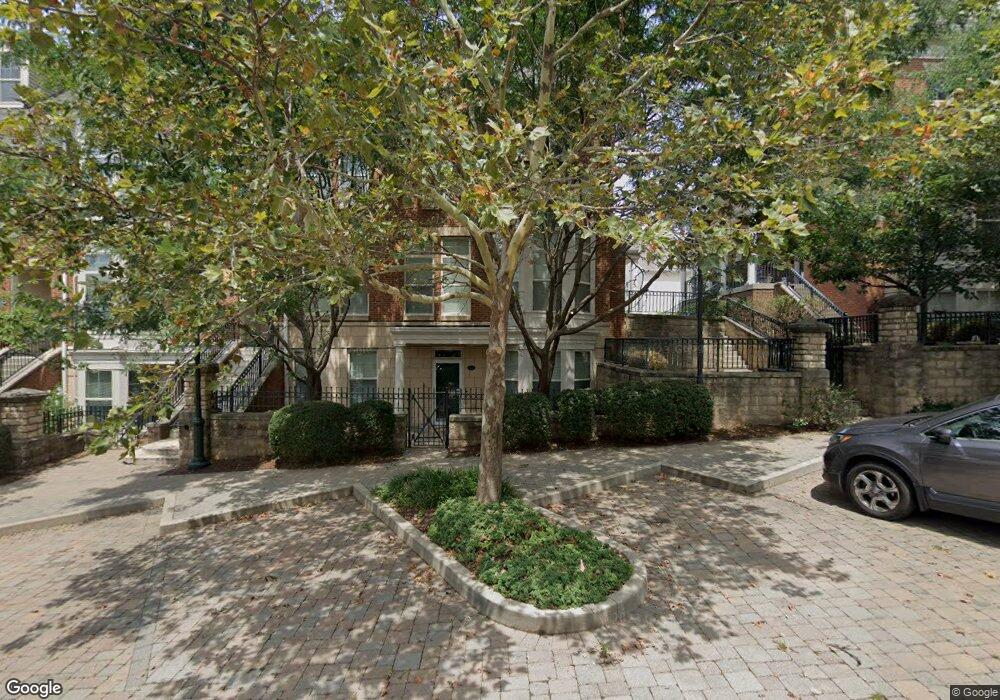
216 Stetson St Unit F1-D1 Cincinnati, OH 45219
Corryville NeighborhoodEstimated Value: $347,531 - $383,000
2
Beds
3
Baths
1,468
Sq Ft
$247/Sq Ft
Est. Value
About This Home
This home is located at 216 Stetson St Unit F1-D1, Cincinnati, OH 45219 and is currently estimated at $362,633, approximately $247 per square foot. 216 Stetson St Unit F1-D1 is a home located in Hamilton County with nearby schools including Rockdale Academy, Robert A. Taft Information Technology High School, and Clark Montessori High School.
Ownership History
Date
Name
Owned For
Owner Type
Purchase Details
Closed on
Sep 6, 2022
Sold by
Diab Dima
Bought by
Shen Nan and Wang Bin
Current Estimated Value
Purchase Details
Closed on
Oct 8, 2012
Sold by
Tartaglia Barbara L and Tartaglia Poure Barbara L
Bought by
Diab Dima
Home Financials for this Owner
Home Financials are based on the most recent Mortgage that was taken out on this home.
Original Mortgage
$212,000
Interest Rate
3.55%
Mortgage Type
Unknown
Purchase Details
Closed on
Jan 14, 2010
Sold by
Stetson Square Builders Llc
Bought by
Tartaglia Barbara L
Home Financials for this Owner
Home Financials are based on the most recent Mortgage that was taken out on this home.
Original Mortgage
$226,320
Interest Rate
5.01%
Mortgage Type
Unknown
Purchase Details
Closed on
Sep 12, 1996
Sold by
University Radiology Fund Of Cincinnati
Bought by
Health Alliance Real Estate Holdings Inc
Create a Home Valuation Report for This Property
The Home Valuation Report is an in-depth analysis detailing your home's value as well as a comparison with similar homes in the area
Home Values in the Area
Average Home Value in this Area
Purchase History
| Date | Buyer | Sale Price | Title Company |
|---|---|---|---|
| Shen Nan | $309,000 | -- | |
| Shen Nan | $309,000 | None Listed On Document | |
| Diab Dima | -- | Ltoc | |
| Tartaglia Barbara L | $282,900 | Attorney | |
| Health Alliance Real Estate Holdings Inc | $569,000 | -- |
Source: Public Records
Mortgage History
| Date | Status | Borrower | Loan Amount |
|---|---|---|---|
| Previous Owner | Diab Dima | $212,000 | |
| Previous Owner | Tartaglia Barbara L | $226,320 |
Source: Public Records
Tax History Compared to Growth
Tax History
| Year | Tax Paid | Tax Assessment Tax Assessment Total Assessment is a certain percentage of the fair market value that is determined by local assessors to be the total taxable value of land and additions on the property. | Land | Improvement |
|---|---|---|---|---|
| 2024 | $6,444 | $108,150 | $14,945 | $93,205 |
| 2023 | $6,590 | $108,150 | $14,945 | $93,205 |
| 2022 | $6,289 | $92,603 | $14,420 | $78,183 |
| 2021 | $944 | $92,603 | $14,420 | $78,183 |
| 2020 | $971 | $92,603 | $14,420 | $78,183 |
| 2019 | $1,036 | $89,905 | $14,000 | $75,905 |
| 2018 | $1,037 | $89,905 | $14,000 | $75,905 |
| 2017 | $985 | $89,905 | $14,000 | $75,905 |
| 2016 | $3,172 | $129,325 | $13,720 | $115,605 |
| 2015 | $1,342 | $129,325 | $13,720 | $115,605 |
| 2014 | $1,351 | $129,325 | $13,720 | $115,605 |
| 2013 | $1,271 | $99,015 | $14,000 | $85,015 |
Source: Public Records
Map
Nearby Homes
- 207 Stetson St
- 252 Stetson St
- 216 Donahue St
- 214 Donahue St
- 3012 Burnet Ave
- 2815 Highland Ave
- 2656 Bellevue Ave
- 2709 Euclid Ave
- 2814 Jefferson Ave
- 3212 Glendora Ave
- 3202 Bishop St
- 3153 Bishop St
- 3157 Bishop St
- 567 Stewart Place
- 3280 Jefferson Ave
- 3440 Harvey Ave
- 3315 Jefferson Ave
- 2408 Highland Ave
- 434 Northern Ave
- 2344 Highland Ave
- 216 Stetson St
- 220 Stetson St
- 220 Stetson St Unit D
- 212 Stetson St
- 218 Stetson St Unit EW
- 222 Stetson St Unit E
- 222 Stetson St Unit E2
- 222 Stetson St Unit F1-E2
- 210 Stetson St
- 210 Stetson St
- 214 Stetson St Unit A
- 214 Stetson St Unit 1
- 224 Stetson St Unit A
- 228 Stetson St Unit C
- 209 Stetson St
- 221 Stetson St
- 213 Stetson St
- 215 Stetson St
- 215 Stetson St Unit G-E1
- 211 Stetson St