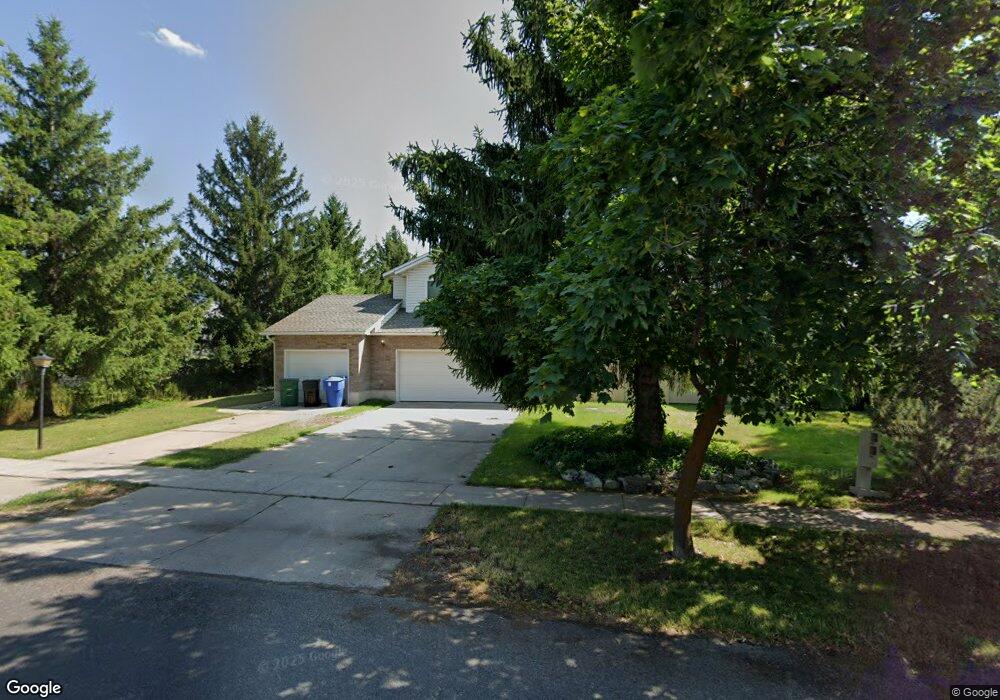
216 W 1330 N Logan, UT 84341
Bridger NeighborhoodEstimated Value: $409,000 - $498,427
4
Beds
4
Baths
2,705
Sq Ft
$168/Sq Ft
Est. Value
About This Home
This home is located at 216 W 1330 N, Logan, UT 84341 and is currently estimated at $455,107, approximately $168 per square foot. 216 W 1330 N is a home located in Cache County with nearby schools including Bridger School, Mount Logan Middle School, and Logan High School.
Ownership History
Date
Name
Owned For
Owner Type
Purchase Details
Closed on
Dec 26, 2019
Sold by
Jimenez Jorge D and Jimenez Jaquelin N
Bought by
Clark Max Alexander and Clark Kimberly Anderson
Current Estimated Value
Home Financials for this Owner
Home Financials are based on the most recent Mortgage that was taken out on this home.
Original Mortgage
$239,920
Outstanding Balance
$211,486
Interest Rate
3.7%
Mortgage Type
New Conventional
Estimated Equity
$243,621
Purchase Details
Closed on
Dec 19, 2018
Sold by
Funderburk William Mark and Funderburk Cindy D
Bought by
Jimenez Jorge D and Jimenez Jaquelin N
Home Financials for this Owner
Home Financials are based on the most recent Mortgage that was taken out on this home.
Original Mortgage
$255,192
Interest Rate
4.87%
Mortgage Type
FHA
Create a Home Valuation Report for This Property
The Home Valuation Report is an in-depth analysis detailing your home's value as well as a comparison with similar homes in the area
Home Values in the Area
Average Home Value in this Area
Purchase History
| Date | Buyer | Sale Price | Title Company |
|---|---|---|---|
| Clark Max Alexander | -- | Advanced Title | |
| Jimenez Jorge D | -- | Inwest Title Services |
Source: Public Records
Mortgage History
| Date | Status | Borrower | Loan Amount |
|---|---|---|---|
| Open | Clark Max Alexander | $239,920 | |
| Previous Owner | Jimenez Jorge D | $255,192 |
Source: Public Records
Tax History
| Year | Tax Paid | Tax Assessment Tax Assessment Total Assessment is a certain percentage of the fair market value that is determined by local assessors to be the total taxable value of land and additions on the property. | Land | Improvement |
|---|---|---|---|---|
| 2025 | $2,011 | $260,080 | $0 | $0 |
| 2024 | $2,076 | $260,080 | $0 | $0 |
| 2023 | $2,168 | $258,870 | $0 | $0 |
| 2022 | $2,001 | $223,120 | $0 | $0 |
| 2021 | $1,936 | $333,540 | $45,000 | $288,540 |
| 2020 | $2,054 | $318,500 | $45,000 | $273,500 |
| 2019 | $1,951 | $289,398 | $45,000 | $244,398 |
| 2018 | $1,902 | $257,520 | $45,000 | $212,520 |
| 2017 | $1,801 | $128,975 | $0 | $0 |
| 2016 | $1,868 | $118,690 | $0 | $0 |
| 2015 | $1,627 | $112,210 | $0 | $0 |
| 2014 | $1,470 | $112,210 | $0 | $0 |
| 2013 | -- | $112,210 | $0 | $0 |
Source: Public Records
Map
Nearby Homes
- 2200 N 220 W
- 1555 N 280 W Unit 102
- 1515 N 450 W Unit 103
- 1030 N 250 W
- 1593 N 160 W Unit 201
- 1368 N 590 W
- 1492 N 565 W Unit 103
- 723 W 1400 N Unit 3
- 519 W 1570 N Unit 103
- 897 N 250 W
- 948 N 480 W
- 49 Kensington Place
- 2 Somerset Place
- 54 Kensington Place
- 905 N 540 W
- 790 N 200 W
- 430 W 810 N
- 1852 N 340 W
- 239 E 1530 N
- 420 W 750 N
Your Personal Tour Guide
Ask me questions while you tour the home.