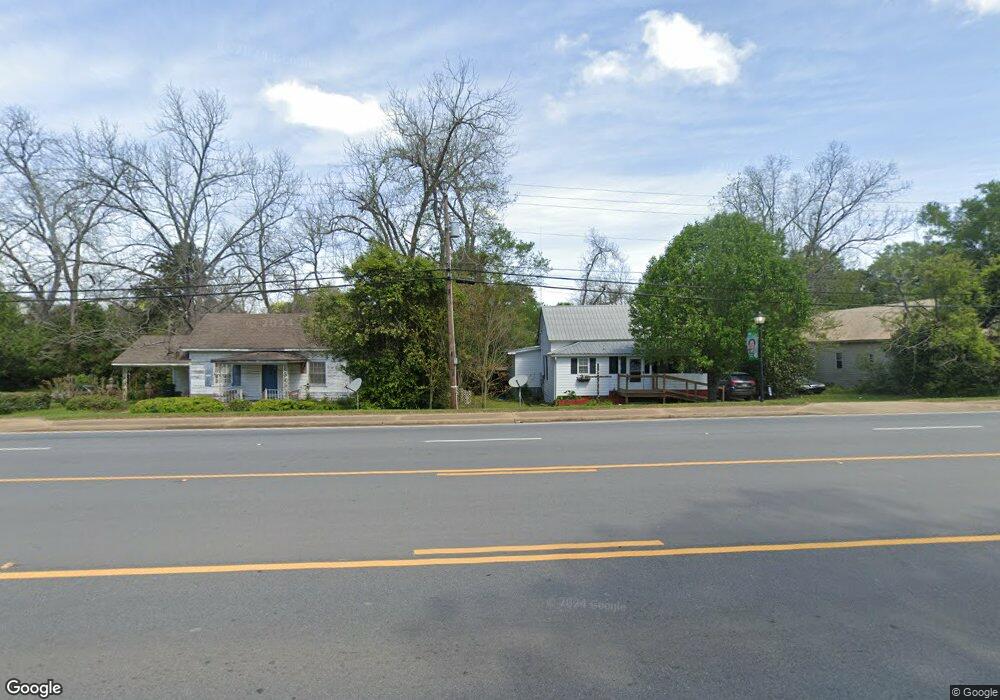
216 W Broad Ave Whigham, GA 39897
Estimated Value: $156,067 - $209,000
3
Beds
2
Baths
1,358
Sq Ft
$141/Sq Ft
Est. Value
About This Home
This home is located at 216 W Broad Ave, Whigham, GA 39897 and is currently estimated at $191,517, approximately $141 per square foot. 216 W Broad Ave is a home located in Grady County.
Ownership History
Date
Name
Owned For
Owner Type
Purchase Details
Closed on
Aug 23, 2013
Sold by
Singletary Troy S
Bought by
Wilkinson Amanda Leeann
Current Estimated Value
Home Financials for this Owner
Home Financials are based on the most recent Mortgage that was taken out on this home.
Original Mortgage
$86,734
Outstanding Balance
$64,294
Interest Rate
4.31%
Mortgage Type
New Conventional
Estimated Equity
$127,223
Purchase Details
Closed on
Jun 2, 2009
Sold by
Singletary Troy S
Bought by
Singletary Troy S and Singletary Pamela K
Purchase Details
Closed on
Oct 25, 2002
Sold by
Singletary Troy S
Bought by
Singletary Troy S
Purchase Details
Closed on
Apr 15, 1999
Sold by
Singletary Samuel L
Bought by
Singletary Troy S
Purchase Details
Closed on
May 4, 1996
Sold by
Singletary J L
Bought by
Singletary Samuel L
Purchase Details
Closed on
Aug 15, 1967
Bought by
Singletary J L
Create a Home Valuation Report for This Property
The Home Valuation Report is an in-depth analysis detailing your home's value as well as a comparison with similar homes in the area
Home Values in the Area
Average Home Value in this Area
Purchase History
| Date | Buyer | Sale Price | Title Company |
|---|---|---|---|
| Wilkinson Amanda Leeann | $85,000 | -- | |
| Singletary Troy S | -- | -- | |
| Singletary Troy S | -- | -- | |
| Singletary Troy S | $20,000 | -- | |
| Singletary Samuel L | -- | -- | |
| Singletary J L | -- | -- |
Source: Public Records
Mortgage History
| Date | Status | Borrower | Loan Amount |
|---|---|---|---|
| Open | Wilkinson Amanda Leeann | $86,734 |
Source: Public Records
Tax History Compared to Growth
Tax History
| Year | Tax Paid | Tax Assessment Tax Assessment Total Assessment is a certain percentage of the fair market value that is determined by local assessors to be the total taxable value of land and additions on the property. | Land | Improvement |
|---|---|---|---|---|
| 2024 | $2,125 | $58,186 | $2,320 | $55,866 |
| 2023 | $1,038 | $28,419 | $1,555 | $26,864 |
| 2022 | $1,038 | $28,419 | $1,555 | $26,864 |
| 2021 | $1,046 | $28,539 | $1,555 | $26,984 |
| 2020 | $1,050 | $28,539 | $1,555 | $26,984 |
| 2019 | $1,050 | $28,539 | $1,555 | $26,984 |
| 2018 | $995 | $28,539 | $1,555 | $26,984 |
| 2017 | $956 | $28,539 | $1,555 | $26,984 |
| 2016 | $822 | $24,100 | $1,555 | $22,545 |
| 2015 | $813 | $24,100 | $1,555 | $22,545 |
| 2014 | $814 | $24,100 | $1,555 | $22,545 |
| 2013 | -- | $22,390 | $1,555 | $20,835 |
Source: Public Records
Map
Nearby Homes
- 165 Larkin St
- 206 Lodge Ln
- 267 Providence Rd
- 723 Providence Rd
- 1718 Old 179 S
- 231 Mcintyre Ln
- 2033 Old 179 N
- 0 Upper Hawthorne Trail
- 0 Earl Hester Rd
- 1520 Upper Hawthorne Trail
- 1137 Summerfield
- 3695 Tired Creek Rd
- 00 Tired Creek Rd
- 1389 Lake Front Dr
- 292 Sykes Mill Rd
- Lot 1 Crine Blvd
- Harrell Mill Rd
- 1500 15th Ave NW
- 316 Faircloth Rd
- 490 13th St SW
- 220 W Broad Ave
- 208 W Broad Ave
- 267 W Broad Ave
- 232 Martin Ave
- 188 W Broad Ave
- 000 Haire Ln
- 235 W Broad Ave
- 180 W Broad Ave
- 142 Walker St NW
- 203 W Broad Ave
- 218 Martin Ave
- 170 W Broad Ave
- 0000 Attapulgus Whigham Rd
- 116 Hudson St SW
- 131 Trulock St
- 176 Martin Ave
- 151 Walker St NW
- 193 Christopher Ave NW
- 172 Martin Ave
- 123 Larkin St