Estimated Value: $177,000 - $264,000
3
Beds
2
Baths
1,692
Sq Ft
$120/Sq Ft
Est. Value
About This Home
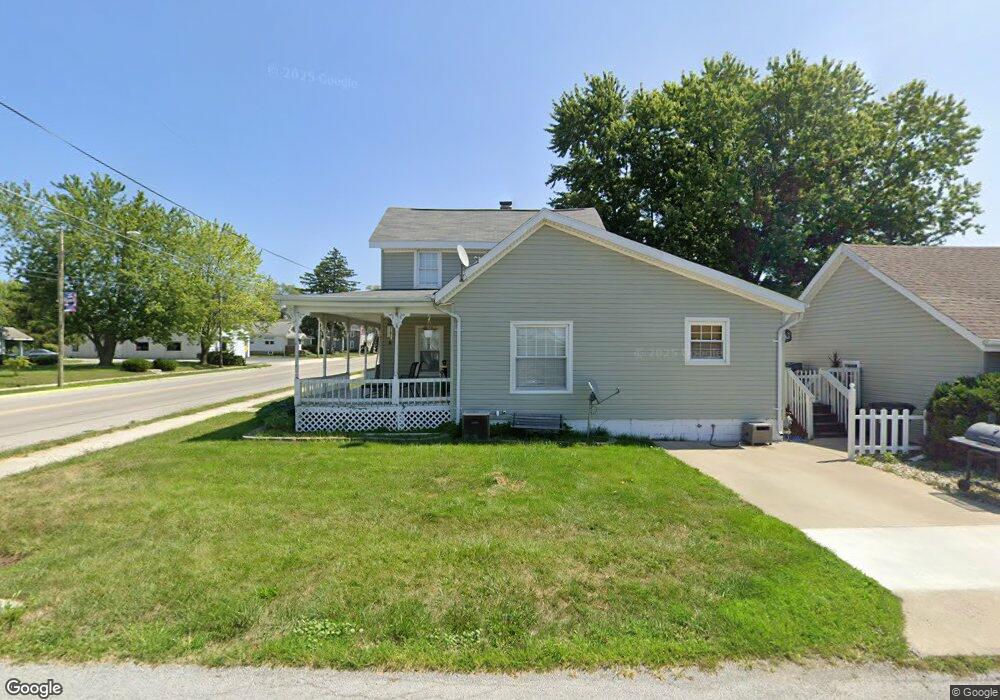
This home is located at 216 W Main St, Cairo, OH 45820 and is currently estimated at $202,447, approximately $119 per square foot. 216 W Main St is a home located in Allen County with nearby schools including Bath Elementary School, Bath Middle School, and Bath High School.
Ownership History
Date
Name
Owned For
Owner Type
Purchase Details
Closed on
May 29, 2018
Sold by
Calvelage Lacy Lee and Calvelage Doug
Bought by
Carrillo Damian and Carrillo Nakia
Current Estimated Value
Home Financials for this Owner
Home Financials are based on the most recent Mortgage that was taken out on this home.
Original Mortgage
$117,826
Outstanding Balance
$101,469
Interest Rate
4.5%
Mortgage Type
FHA
Estimated Equity
$100,978
Purchase Details
Closed on
May 18, 2016
Sold by
Reese Jamie Dwayne and Reese Michelle L
Bought by
Williams Lacy Lee
Home Financials for this Owner
Home Financials are based on the most recent Mortgage that was taken out on this home.
Original Mortgage
$119,280
Interest Rate
3.59%
Mortgage Type
New Conventional
Purchase Details
Closed on
Jun 16, 1998
Sold by
O'Donnell Shirley
Bought by
O'Donnell Chad
Purchase Details
Closed on
May 21, 1991
Bought by
Odonnell Robert G
Create a Home Valuation Report for This Property
The Home Valuation Report is an in-depth analysis detailing your home's value as well as a comparison with similar homes in the area
Purchase History
| Date | Buyer | Sale Price | Title Company |
|---|---|---|---|
| Carrillo Damian | $120,000 | Title Source Inc | |
| Williams Lacy Lee | $110,000 | None Available | |
| O'Donnell Chad | $67,000 | -- | |
| Odonnell Robert G | $45,000 | -- |
Source: Public Records
Mortgage History
| Date | Status | Borrower | Loan Amount |
|---|---|---|---|
| Open | Carrillo Damian | $117,826 | |
| Previous Owner | Williams Lacy Lee | $119,280 | |
| Closed | O'Donnell Chad | $0 |
Source: Public Records
Tax History
| Year | Tax Paid | Tax Assessment Tax Assessment Total Assessment is a certain percentage of the fair market value that is determined by local assessors to be the total taxable value of land and additions on the property. | Land | Improvement |
|---|---|---|---|---|
| 2024 | $2,316 | $55,340 | $3,570 | $51,770 |
| 2023 | $2,487 | $39,240 | $2,520 | $36,720 |
| 2022 | $2,354 | $39,240 | $2,520 | $36,720 |
| 2021 | $1,848 | $39,240 | $2,520 | $36,720 |
| 2020 | $2,483 | $31,330 | $2,420 | $28,910 |
| 2019 | $2,483 | $31,330 | $2,420 | $28,910 |
| 2018 | $1,605 | $31,330 | $2,420 | $28,910 |
| 2017 | $1,411 | $27,660 | $2,420 | $25,240 |
| 2016 | $1,390 | $27,660 | $2,420 | $25,240 |
| 2015 | $1,390 | $27,660 | $2,420 | $25,240 |
| 2014 | $1,390 | $26,850 | $2,280 | $24,570 |
| 2013 | $1,202 | $23,280 | $2,280 | $21,000 |
Source: Public Records
Map
Nearby Homes
- 102 W Main St
- 201 Wall St
- 513 W Main St
- 634 W Main St
- 1085 Lutz Rd
- 4310 Slabtown Rd
- 4387 N West St
- 3465 Sugar Creek Rd
- 3263 Shiloh Dr
- 0 Fraunfelter Unit 307817
- 0 N Eastown Rd Unit 1034495
- 535 W Bluelick Rd
- 0 Thorndyke Dr
- 3137 Thorndyke Dr
- 2525 W Lincoln Hwy
- 2878 Autumn Lake Dr
- 0 N Dixie Hwy Unit 300253
- 475 Kenmore St
- 520 Kenmore St
- 5025 N Cool Rd
Your Personal Tour Guide
Ask me questions while you tour the home.