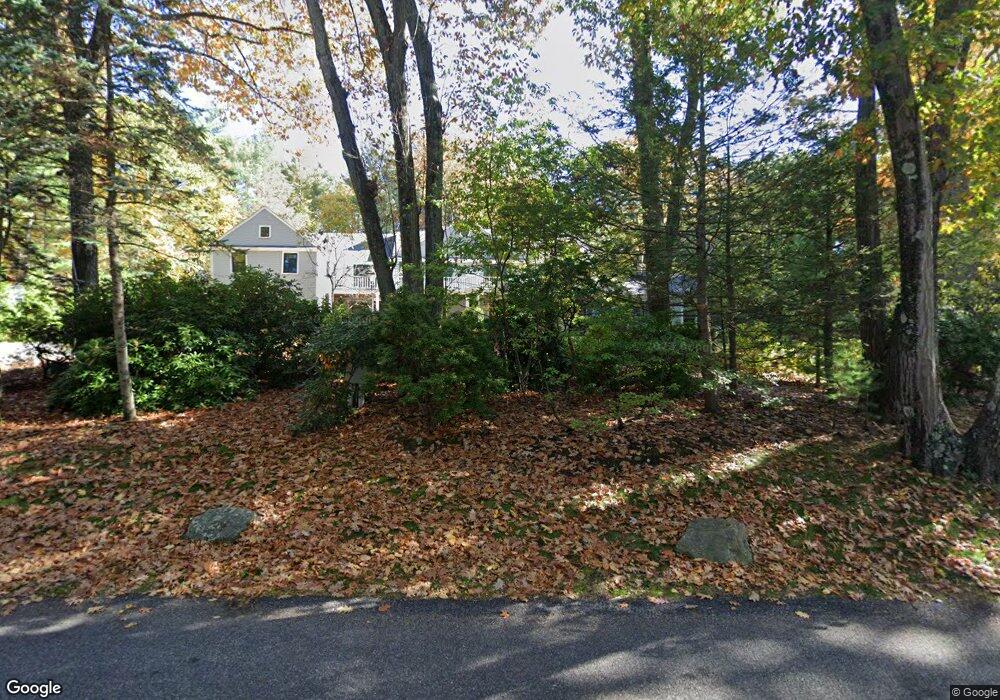
216 Westerly Rd Weston, MA 02493
Estimated Value: $3,807,341 - $4,261,000
5
Beds
7
Baths
5,000
Sq Ft
$806/Sq Ft
Est. Value
About This Home
This home is located at 216 Westerly Rd, Weston, MA 02493 and is currently estimated at $4,027,835, approximately $805 per square foot. 216 Westerly Rd is a home located in Middlesex County with nearby schools including Country Elementary School, Woodland Elementary School, and Field Elementary School.
Ownership History
Date
Name
Owned For
Owner Type
Purchase Details
Closed on
Feb 3, 2011
Sold by
Westerly Rt and Friedman Andrew D
Bought by
Friedman Andrew D and Friedman Allison T
Current Estimated Value
Home Financials for this Owner
Home Financials are based on the most recent Mortgage that was taken out on this home.
Original Mortgage
$470,000
Outstanding Balance
$18,145
Interest Rate
4.82%
Mortgage Type
Purchase Money Mortgage
Estimated Equity
$4,009,690
Purchase Details
Closed on
Mar 9, 2005
Sold by
216 Westerly Road Nt and Strauss Linda Shapiro
Bought by
Friedman Andrew D and Friedman Robert L
Home Financials for this Owner
Home Financials are based on the most recent Mortgage that was taken out on this home.
Original Mortgage
$500,000
Interest Rate
5.64%
Mortgage Type
Purchase Money Mortgage
Create a Home Valuation Report for This Property
The Home Valuation Report is an in-depth analysis detailing your home's value as well as a comparison with similar homes in the area
Home Values in the Area
Average Home Value in this Area
Purchase History
| Date | Buyer | Sale Price | Title Company |
|---|---|---|---|
| Friedman Andrew D | -- | -- | |
| Friedman Andrew D | $2,100,000 | -- |
Source: Public Records
Mortgage History
| Date | Status | Borrower | Loan Amount |
|---|---|---|---|
| Open | Friedman Andrew D | $470,000 | |
| Previous Owner | Friedman Andrew D | $500,000 |
Source: Public Records
Tax History Compared to Growth
Tax History
| Year | Tax Paid | Tax Assessment Tax Assessment Total Assessment is a certain percentage of the fair market value that is determined by local assessors to be the total taxable value of land and additions on the property. | Land | Improvement |
|---|---|---|---|---|
| 2025 | $36,750 | $3,310,800 | $1,154,300 | $2,156,500 |
| 2024 | $35,798 | $3,219,200 | $1,154,300 | $2,064,900 |
| 2023 | $35,547 | $3,002,300 | $1,154,300 | $1,848,000 |
| 2022 | $33,986 | $2,653,100 | $1,104,300 | $1,548,800 |
| 2021 | $4,890 | $2,527,300 | $1,049,100 | $1,478,200 |
| 2020 | $4,680 | $2,432,800 | $1,049,100 | $1,383,700 |
| 2019 | $30,780 | $2,444,800 | $1,049,100 | $1,395,700 |
| 2018 | $30,584 | $2,444,800 | $1,049,100 | $1,395,700 |
| 2017 | $16,579 | $2,442,400 | $1,049,100 | $1,393,300 |
| 2016 | $29,897 | $2,458,600 | $1,049,100 | $1,409,500 |
| 2015 | $29,122 | $2,371,500 | $999,300 | $1,372,200 |
Source: Public Records
Map
Nearby Homes
- 12 Astra
- 1 Astra Unit 1
- 7 Fox Hollow
- 8 Fox Hollow
- 9 Christina
- 1004 Wisteria Way
- 286 Country Dr
- 23 Covered Bridge Ln
- 42 Westerly Rd
- 1601 Wisteria Way
- 1605 Wisteria Way
- 180 Highland St
- 82 Buckskin Dr
- 6 Steepletree Ln
- 18 Coltsway Unit 18
- 72 Love Ln
- 19 Old Connecticut Path
- 12 Cutting Cross Way
- 620 South Ave
- 2 Forest Hill Rd