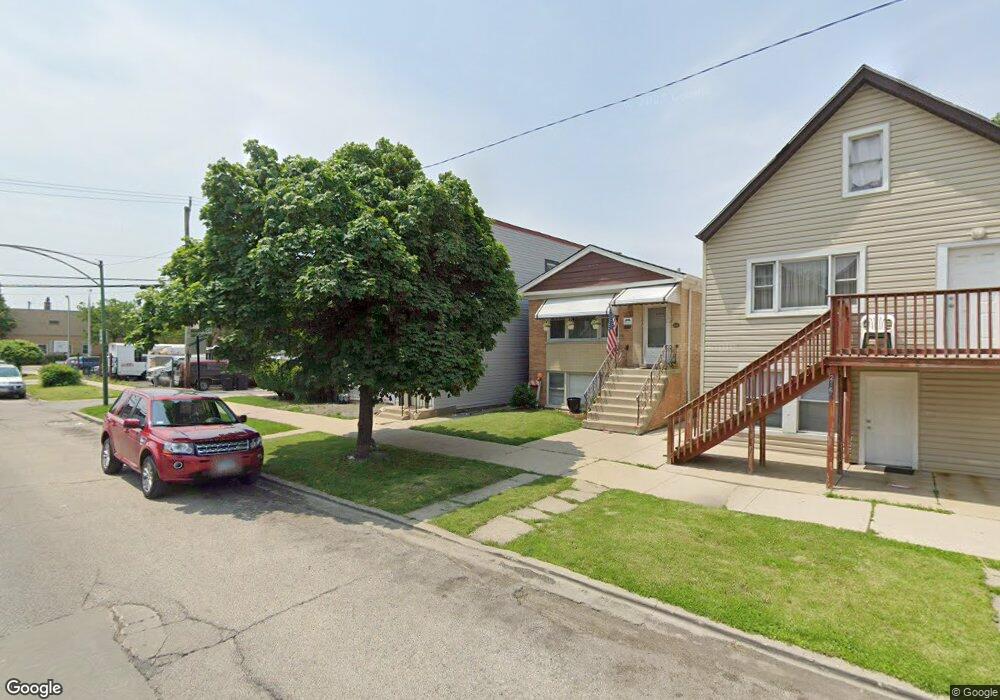
2160 N Major Ave Unit 1FB Chicago, IL 60639
Belmont Central Neighborhood
--
Bed
2
Baths
2,410
Sq Ft
--
Built
About This Home
This home is located at 2160 N Major Ave Unit 1FB, Chicago, IL 60639. 2160 N Major Ave Unit 1FB is a home located in Cook County with nearby schools including Prieto Math-Science Elementary School, Steinmetz College Prep, and Horizon Science Academy-Belmont.
Create a Home Valuation Report for This Property
The Home Valuation Report is an in-depth analysis detailing your home's value as well as a comparison with similar homes in the area
Home Values in the Area
Average Home Value in this Area
Tax History
| Year | Tax Paid | Tax Assessment Tax Assessment Total Assessment is a certain percentage of the fair market value that is determined by local assessors to be the total taxable value of land and additions on the property. | Land | Improvement |
|---|---|---|---|---|
| 2025 | $3,100 | $36,000 | $7,006 | $28,994 |
| 2024 | $3,100 | $36,000 | $7,006 | $28,994 |
| 2023 | $3,000 | $18,001 | $5,681 | $12,320 |
| 2022 | $3,000 | $18,001 | $5,681 | $12,320 |
| 2021 | $2,952 | $17,999 | $5,680 | $12,319 |
| 2020 | $4,247 | $22,158 | $4,733 | $17,425 |
| 2019 | $4,490 | $25,766 | $4,733 | $21,033 |
| 2018 | $4,414 | $25,766 | $4,733 | $21,033 |
| 2017 | $4,865 | $25,962 | $4,165 | $21,797 |
| 2016 | $4,702 | $25,962 | $4,165 | $21,797 |
| 2015 | $4,279 | $25,962 | $4,165 | $21,797 |
| 2014 | $3,533 | $21,597 | $3,787 | $17,810 |
| 2013 | $3,452 | $21,597 | $3,787 | $17,810 |
Source: Public Records
Map
Nearby Homes
- 2110 N Mango Ave
- 2240 N Monitor Ave
- 2341 N Major Ave
- 2223 N Mason Ave
- 2146 N Mcvicker Ave
- 2437 N Central Ave
- 2208 N Lorel Ave
- 1925 N Lotus Ave
- 1921 N Lotus Ave
- 2165 N Moody Ave
- 1909 N Lorel Ave
- 1907 N Lorel Ave
- 2456 N Mason Ave
- 1920 N Long Ave
- 1918 N Long Ave
- 1916 N Long Ave
- 1742 N Mayfield Ave
- 2170 N Moody Ave
- 2102 N Moody Ave
- 2246 N Lockwood Ave
- 2163 N Mango Ave
- 5718 W Grand Ave Unit 2
- 5726 W Grand Ave
- 5720 W Grand Ave
- 5720 W Grand Ave Unit 1
- 5720 W Grand Ave Unit 3
- 5720 W Grand Ave Unit 2
- 5716 W Grand Ave
- 5714 W Grand Ave
- 5714 W Grand Ave Unit 2R
- 5714 W Grand Ave Unit 1R
- 5714 W Grand Ave
- 5712 W Grand Ave Unit 2
- 2167 N Mango Ave Unit 11R
- 2167 N Mango Ave Unit 11R
- 2167 N Mango Ave
- 5723 W Grand Ave
- 5736 W Grand Ave
- 2171 N Mango Ave
- 5737 W Grand Ave
Your Personal Tour Guide
Ask me questions while you tour the home.