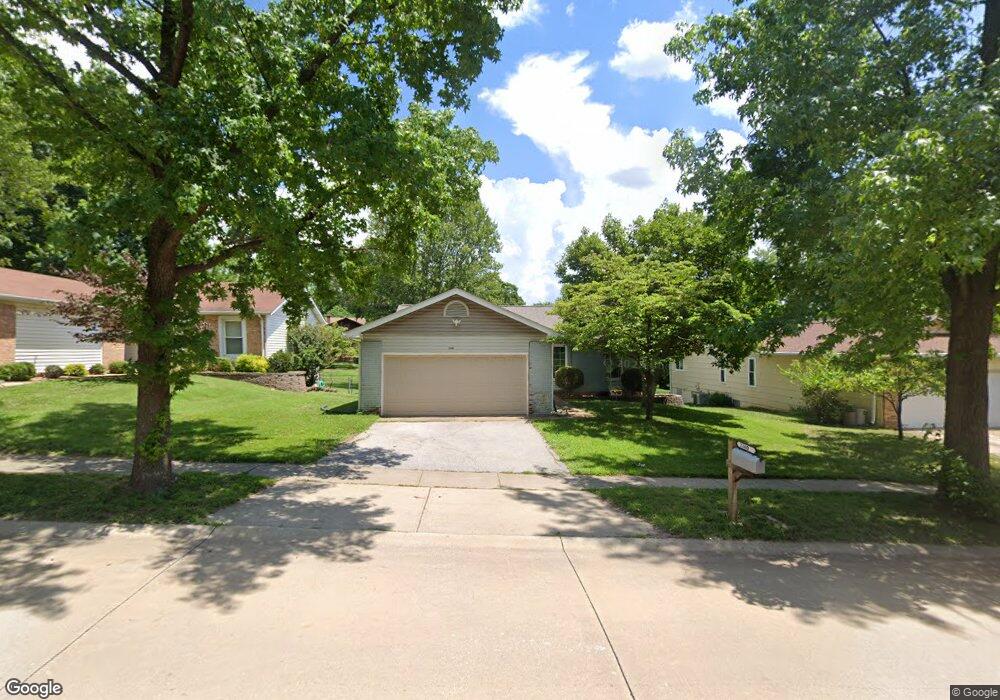
2160 Pheasant Run Dr Maryland Heights, MO 63043
Estimated Value: $336,500 - $377,000
3
Beds
2
Baths
1,440
Sq Ft
$246/Sq Ft
Est. Value
About This Home
This home is located at 2160 Pheasant Run Dr, Maryland Heights, MO 63043 and is currently estimated at $354,125, approximately $245 per square foot. 2160 Pheasant Run Dr is a home located in St. Louis County with nearby schools including McKelvey Elementary School, Parkway Northeast Middle School, and Parkway North High School.
Ownership History
Date
Name
Owned For
Owner Type
Purchase Details
Closed on
Dec 12, 2013
Sold by
Khondaker Sahed and Khondaker Shaheda
Bought by
Khondaker Sahed and Khondaker Shaheda
Current Estimated Value
Home Financials for this Owner
Home Financials are based on the most recent Mortgage that was taken out on this home.
Original Mortgage
$146,879
Outstanding Balance
$109,782
Interest Rate
4.21%
Mortgage Type
New Conventional
Estimated Equity
$244,343
Purchase Details
Closed on
Sep 5, 2002
Sold by
Novotny Michelle C
Bought by
Kulik Eugeniy
Purchase Details
Closed on
Apr 30, 2001
Sold by
Feng Zee Cheng Chi and Feng Joyce S
Bought by
Kulik Eugeniy and Novotny Michele C
Home Financials for this Owner
Home Financials are based on the most recent Mortgage that was taken out on this home.
Original Mortgage
$160,550
Interest Rate
6.87%
Create a Home Valuation Report for This Property
The Home Valuation Report is an in-depth analysis detailing your home's value as well as a comparison with similar homes in the area
Home Values in the Area
Average Home Value in this Area
Purchase History
| Date | Buyer | Sale Price | Title Company |
|---|---|---|---|
| Khondaker Sahed | -- | Fidelity National Title | |
| Kulik Eugeniy | -- | -- | |
| Kulik Eugeniy | $169,000 | -- |
Source: Public Records
Mortgage History
| Date | Status | Borrower | Loan Amount |
|---|---|---|---|
| Open | Khondaker Sahed | $146,879 | |
| Previous Owner | Kulik Eugeniy | $160,550 |
Source: Public Records
Tax History Compared to Growth
Tax History
| Year | Tax Paid | Tax Assessment Tax Assessment Total Assessment is a certain percentage of the fair market value that is determined by local assessors to be the total taxable value of land and additions on the property. | Land | Improvement |
|---|---|---|---|---|
| 2025 | $3,948 | $59,070 | $13,890 | $45,180 |
| 2024 | $3,948 | $55,310 | $11,570 | $43,740 |
| 2023 | $3,909 | $55,310 | $11,570 | $43,740 |
| 2022 | $3,685 | $47,630 | $11,570 | $36,060 |
| 2021 | $3,720 | $47,630 | $11,570 | $36,060 |
| 2020 | $3,396 | $43,840 | $15,490 | $28,350 |
| 2019 | $3,353 | $43,840 | $15,490 | $28,350 |
| 2018 | $2,975 | $35,790 | $10,030 | $25,760 |
| 2017 | $2,943 | $35,790 | $10,030 | $25,760 |
| 2016 | $2,712 | $31,400 | $7,730 | $23,670 |
| 2015 | $2,832 | $31,400 | $7,730 | $23,670 |
| 2014 | $2,728 | $33,100 | $7,430 | $25,670 |
Source: Public Records
Map
Nearby Homes
- 2234 Arborview Dr
- 12201 Dr
- 2213 Rule Ave
- 2 Aspen II
- 2 Nottingham at Louiselle Park
- 2041 Falling Brook Dr
- 2229 Murray Forest Dr
- 2 Hermitage II at Louiselle Park
- 2 Ashford at Louiselle Park
- 2 Sterling at Louiselle Park
- 12241 Rain Hollow Dr
- 2 Sequoia at Louiselle Park
- 2427 Pheasant Run Dr
- 2 Royal II at Louiselle Park
- 2444 Pheasant Run Dr
- 2 Pin Oak at Louiselle Park
- 2244 Canyonlands Dr Unit B
- 2244 Canyonlands Dr Unit E
- 2 Hickory at Louiselle Park
- 11932 Ameling Rd
- 2166 Pheasant Run Dr
- 2156 Pheasant Run Dr
- 2152 Pheasant Run Dr
- 2170 Pheasant Run Dr
- 2148 Pheasant Run Dr
- 2177 Cherrycove Ct
- 2181 Cherrycove Ct
- 2174 Pheasant Run Dr
- 12117 Sage Glen Ct
- 2185 Cherrycove Ct
- 2173 Cherrycove Ct
- 2169 Cherrycove Ct
- 2144 Pheasant Run Dr
- 2189 Cherrycove Ct
- 12123 Sage Glen Ct
- 12118 Sage Glen Ct
- 2193 Cherrycove Ct
- 2165 Cherrycove Ct
- 2182 Pheasant Run Dr
- 12129 Sage Glen Ct