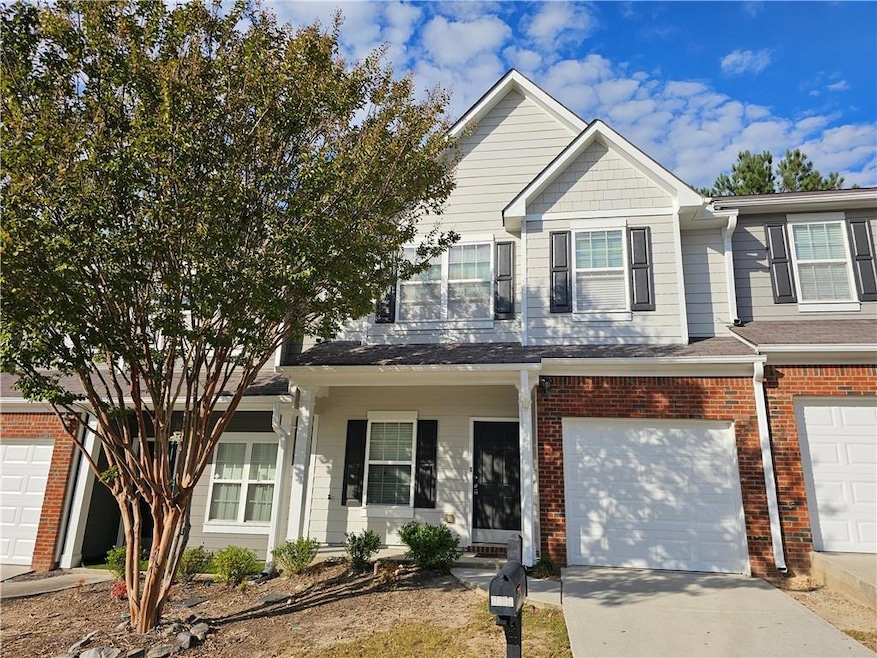
2160 Spikerush Way Buford, GA 30519
Highlights
- Home Energy Rating Service (HERS) Rated Property
- Traditional Architecture
- Ceiling height of 9 feet on the main level
- Patrick Elementary School Rated A
- Community Pool
- 1 Car Attached Garage
About This Home
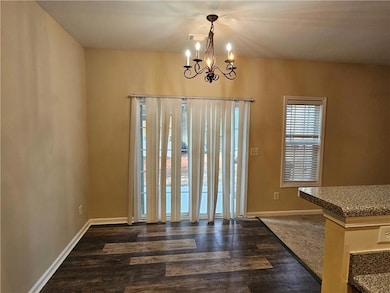
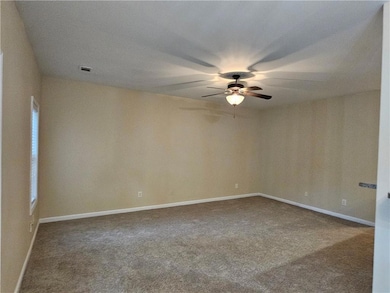
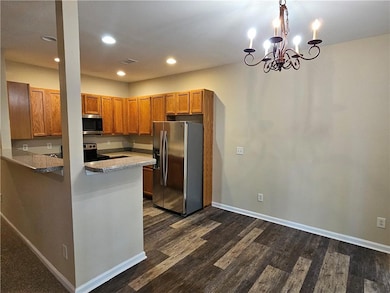
Nice three bedrooms, two and a half baths located in excellent neighborhood in a sought after school district. Ready to Move in. Stained cabinets and open view to the family room, Extra loft area just perfect for dual den or home office and laundry room upstairs, Community pool, play area, Just minutes away from Mall of Georgia, I-85, I-985 ! Great Location!!!
Listing Agent
RE/MAX Center Brokerage Phone: 678-462-3010 License #257699 Listed on: 12/05/2025

Townhouse Details
Home Type
- Townhome
Est. Annual Taxes
- $4,185
Year Built
- Built in 2006
Parking
- 1 Car Attached Garage
- Garage Door Opener
- Driveway Level
Home Design
- Traditional Architecture
- Cement Siding
Interior Spaces
- 1,491 Sq Ft Home
- 2-Story Property
- Roommate Plan
- Ceiling height of 9 feet on the main level
- Factory Built Fireplace
- Fireplace With Gas Starter
- Entrance Foyer
- Family Room with Fireplace
- Carpet
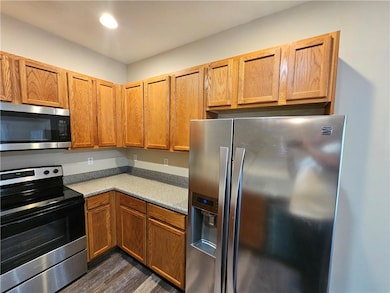
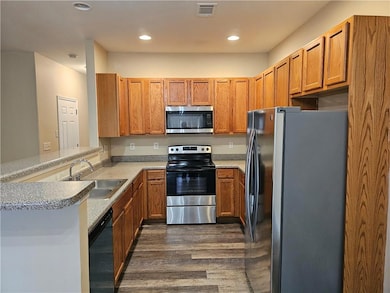
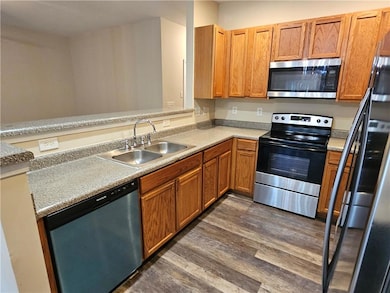
Kitchen
- Eat-In Kitchen
- Electric Range
- Microwave
- Dishwasher
- Laminate Countertops
- Wood Stained Kitchen Cabinets
- Disposal
Bedrooms and Bathrooms
- 3 Bedrooms
- Split Bedroom Floorplan
- Walk-In Closet
- Bathtub and Shower Combination in Primary Bathroom
Laundry
- Laundry Room
- Laundry on upper level
Schools
- Patrick Elementary School
- Jones Middle School
- Seckinger High School
Utilities
- Forced Air Zoned Heating and Cooling System
- Underground Utilities
- Electric Water Heater
- High Speed Internet
- Cable TV Available
Additional Features
- Accessible Entrance
- Home Energy Rating Service (HERS) Rated Property
- Two or More Common Walls
Listing and Financial Details
- Security Deposit $1,900
- $100 Move-In Fee
- 12 Month Lease Term
- $65 Application Fee
Community Details
Overview
- Property has a Home Owners Association
- Application Fee Required
- Mill Creek Lakes Subdivision
Recreation
- Community Playground
- Community Pool
Pet Policy
- Call for details about the types of pets allowed
Map
Source: First Multiple Listing Service (FMLS)
MLS Number: 7689355
APN: 7-178-400
Disclaimer: Certain information contained herein is derived from information provided by parties other than Homes.com. All information provided is deemed reliable, but is not guaranteed to be accurate and should be independently verified.
![]() Listings identified with the FMLS IDX logo come from FMLS and are held by brokerage firms other than the owner of this website. The listing brokerage is identified in any listing details. Information is deemed reliable but is not guaranteed. If you believe any FMLS listing contains material that infringes your copyrighted work please visit www.fmls.com/dmca to review our DMCA policy and learn how to submit a takedown request. © 2025 First Multiple Listing Service, Inc.
Listings identified with the FMLS IDX logo come from FMLS and are held by brokerage firms other than the owner of this website. The listing brokerage is identified in any listing details. Information is deemed reliable but is not guaranteed. If you believe any FMLS listing contains material that infringes your copyrighted work please visit www.fmls.com/dmca to review our DMCA policy and learn how to submit a takedown request. © 2025 First Multiple Listing Service, Inc.
- 3068 Cedar Glade Ln
- 3056 Cedar Glade Ln
- 2141 Spikerush Way
- 3275 Wild Basil Ln
- 3279 Wild Basil Ln
- 2106 Mill Garden Run
- 3301 Wild Basil Ln
- 3282 Mill Springs Cir
- 3294 Mill Springs Cir
- 3263 Mill Springs Cir NE
- 3267 Mill Springs Cir
- 2123 Mill Garden Run
- 3160 Mill Springs Cir NE
- 2295 Bellyard Dr
- 2426 Bellyard Dr
- 2505 Poppy Ct
- 2515 Poppy Ct
- 2150 Spikerush Way
- 3071 Cedar Glade Ln
- 3166 Cedar Glade Ln Unit 4
- 3331 Greyton Dr
- 2213 Blue Monarch Dr
- 3061 Greyton Dr
- 2344 Attewood Dr
- 2415 Poppy Ct
- 3194 Mill Springs Cir
- 2214 Mill Garden Place
- 3177 Mill Springs Cir
- 2465 Poppy Ct
- 2475 Poppy Ct
- 2485 Poppy Ct
- 3179 Mill Springs Cir NE
- 2495 Poppy Ct
- 2585 Poppy Ct
- 2605 Poppy Ct
- 2625 Poppy Ct
- 2275 Copper Trail Ln