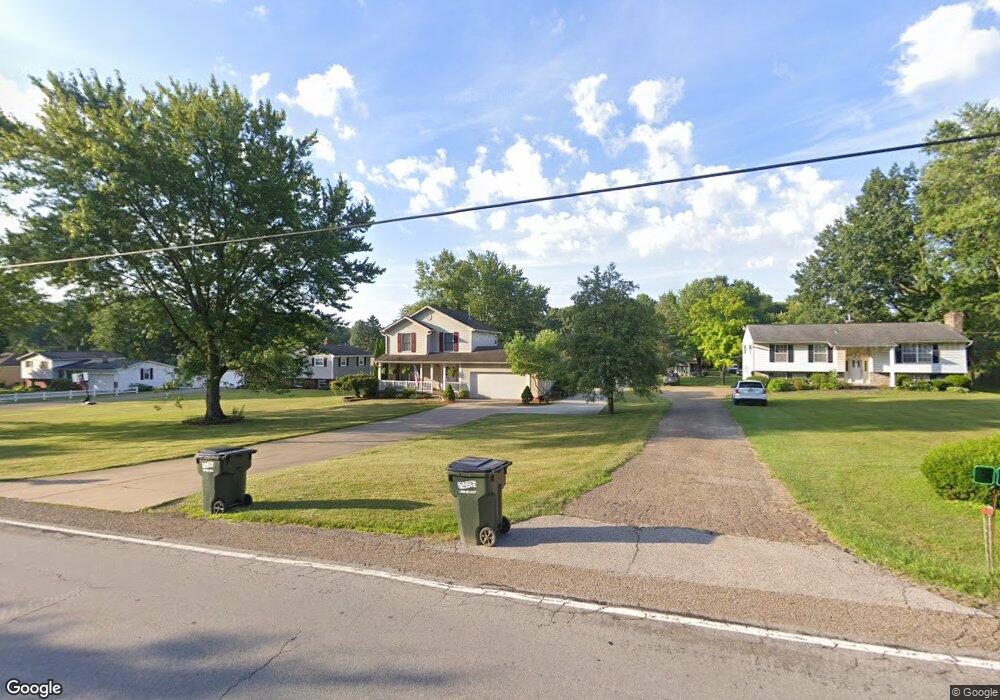
2160 State St NE Canton, OH 44721
Estimated Value: $298,000 - $359,000
3
Beds
2
Baths
1,746
Sq Ft
$195/Sq Ft
Est. Value
About This Home
This home is located at 2160 State St NE, Canton, OH 44721 and is currently estimated at $340,019, approximately $194 per square foot. 2160 State St NE is a home located in Stark County with nearby schools including Lake Middle/High School.
Ownership History
Date
Name
Owned For
Owner Type
Purchase Details
Closed on
Sep 29, 2022
Sold by
Loudon Scott D and Loudon Tiffany F
Bought by
Loudon Scott D
Current Estimated Value
Purchase Details
Closed on
Oct 19, 2004
Sold by
Nicely Built Inc
Bought by
Loudon Scott D and Loudon Tiffany F Lee
Home Financials for this Owner
Home Financials are based on the most recent Mortgage that was taken out on this home.
Original Mortgage
$114,695
Interest Rate
5.93%
Mortgage Type
FHA
Purchase Details
Closed on
Apr 27, 2004
Sold by
Oliver Dina and The Rainieri Family Trust
Bought by
Nicely Built Inc
Home Financials for this Owner
Home Financials are based on the most recent Mortgage that was taken out on this home.
Original Mortgage
$91,000
Interest Rate
5.46%
Mortgage Type
Construction
Purchase Details
Closed on
Apr 28, 1993
Create a Home Valuation Report for This Property
The Home Valuation Report is an in-depth analysis detailing your home's value as well as a comparison with similar homes in the area
Purchase History
| Date | Buyer | Sale Price | Title Company |
|---|---|---|---|
| Loudon Scott D | -- | -- | |
| Loudon Scott D | $116,000 | Firstmerit Title Agency | |
| Nicely Built Inc | $27,800 | -- | |
| -- | -- | -- |
Source: Public Records
Mortgage History
| Date | Status | Borrower | Loan Amount |
|---|---|---|---|
| Previous Owner | Loudon Scott D | $114,695 | |
| Previous Owner | Nicely Built Inc | $91,000 |
Source: Public Records
Tax History
| Year | Tax Paid | Tax Assessment Tax Assessment Total Assessment is a certain percentage of the fair market value that is determined by local assessors to be the total taxable value of land and additions on the property. | Land | Improvement |
|---|---|---|---|---|
| 2025 | -- | $100,700 | $28,420 | $72,280 |
| 2024 | -- | $100,700 | $28,420 | $72,280 |
| 2023 | $3,360 | $71,790 | $17,710 | $54,080 |
| 2022 | $3,371 | $71,790 | $17,710 | $54,080 |
| 2021 | $3,410 | $71,790 | $17,710 | $54,080 |
| 2020 | $3,615 | $68,250 | $16,590 | $51,660 |
| 2019 | $3,582 | $68,260 | $16,600 | $51,660 |
Source: Public Records
Map
Nearby Homes
- 8459 Whitmer Ave NE
- 8294 Turquoise Ave NE
- 8060 Garnet Ave NE
- 10311 Hunting Hills Ave NE
- 10299 Hunting Hills Ave NE
- 3359 Nimishillen Church Rd NE
- 3212 Foxmoor St NE
- 9856 Market Ave N
- 7622 Marelis Ave NE
- 8140 W Wadora Cir NW
- 7416 Woodcrest Ave NE
- 2252 Applegrove St NE
- 1068 Ivy St NW
- 3404 Wicker St NE
- 0 Fiddler Court Cir NE
- 7674 Knollridge Ave NE
- 7431 Middlebranch Ave NE
- 7606 Knollridge Ave NE
- 1170 Smith Kramer St NE
- 11121 Geib Ave NE
- 2132 State St NE
- 2192 State St NE
- 2120 State St NE
- 2191 State St NE
- 2212 State St NE
- 2104 State St NE
- 2113 State St NE
- 2225 State St NE
- 2151 State St NE
- 2091 State St NE
- 2250 State St NE
- 99999 Peterson Ave NE
- 9020 Peterson Ave NE
- 2060 State St NE
- 2042 State St NE
- 2041 State St NE
- 2296 State St NE
- 9000 Peterson Ave NE
- 2034 State St NE
- 8980 Peterson Ave NE
Your Personal Tour Guide
Ask me questions while you tour the home.