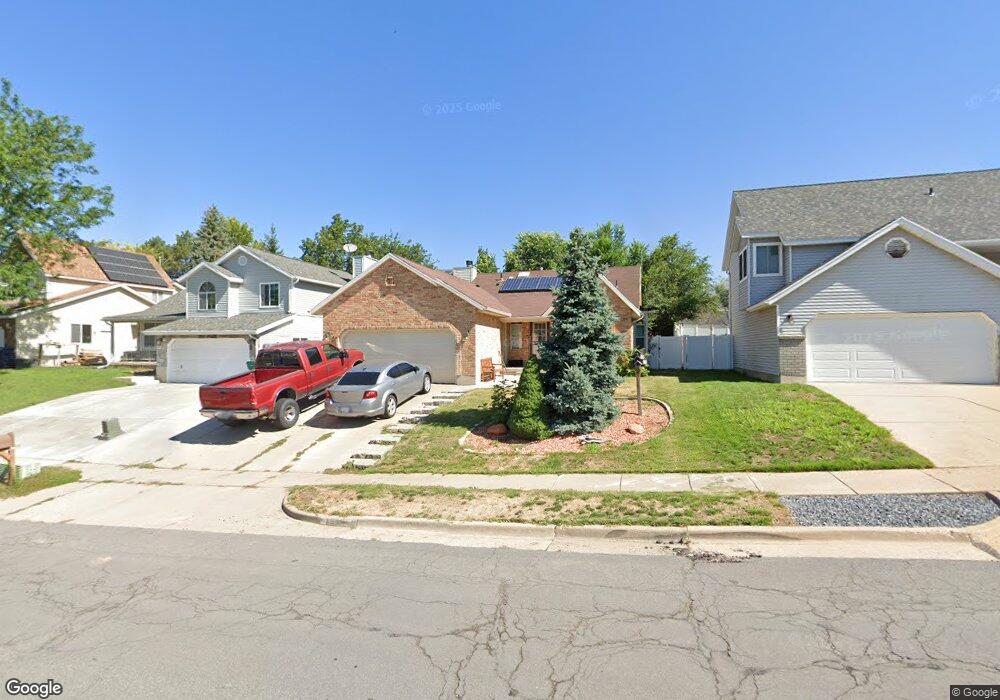
2161 E 3000 N Layton, UT 84040
Estimated Value: $490,000 - $550,998
4
Beds
3
Baths
2,692
Sq Ft
$195/Sq Ft
Est. Value
About This Home
This home is located at 2161 E 3000 N, Layton, UT 84040 and is currently estimated at $525,000, approximately $195 per square foot. 2161 E 3000 N is a home located in Davis County with nearby schools including Mountain View Elementary School, North Layton Junior High School, and Northridge High School.
Ownership History
Date
Name
Owned For
Owner Type
Purchase Details
Closed on
Sep 27, 2019
Sold by
Fry James and Fry Ami
Bought by
Butler Jeremy J
Current Estimated Value
Home Financials for this Owner
Home Financials are based on the most recent Mortgage that was taken out on this home.
Original Mortgage
$289,595
Outstanding Balance
$253,663
Interest Rate
3.6%
Mortgage Type
VA
Estimated Equity
$271,337
Purchase Details
Closed on
Jul 28, 2008
Sold by
Perry Everett B and Perry Cindy L
Bought by
Arnold Jeffrey A and Arnold Melissa B
Home Financials for this Owner
Home Financials are based on the most recent Mortgage that was taken out on this home.
Original Mortgage
$180,800
Interest Rate
6.31%
Mortgage Type
Purchase Money Mortgage
Purchase Details
Closed on
Jan 28, 2004
Sold by
Czarnecki Michael T
Bought by
Perry Everett B and Perry Cindy L
Create a Home Valuation Report for This Property
The Home Valuation Report is an in-depth analysis detailing your home's value as well as a comparison with similar homes in the area
Home Values in the Area
Average Home Value in this Area
Purchase History
| Date | Buyer | Sale Price | Title Company |
|---|---|---|---|
| Butler Jeremy J | -- | Mountain View Title | |
| Arnold Jeffrey A | -- | Founders Title Co Slc | |
| Perry Everett B | -- | Equity Title Agency |
Source: Public Records
Mortgage History
| Date | Status | Borrower | Loan Amount |
|---|---|---|---|
| Open | Butler Jeremy J | $289,595 | |
| Previous Owner | Arnold Jeffrey A | $180,800 |
Source: Public Records
Tax History
| Year | Tax Paid | Tax Assessment Tax Assessment Total Assessment is a certain percentage of the fair market value that is determined by local assessors to be the total taxable value of land and additions on the property. | Land | Improvement |
|---|---|---|---|---|
| 2025 | $4,697 | $493,000 | $161,206 | $331,794 |
| 2024 | $2,471 | $261,249 | $117,200 | $144,049 |
| 2023 | $2,468 | $460,000 | $171,319 | $288,681 |
| 2022 | $2,614 | $264,550 | $90,686 | $173,864 |
| 2021 | $2,339 | $353,000 | $136,110 | $216,890 |
| 2020 | $2,113 | $306,000 | $102,942 | $203,058 |
| 2019 | $2,094 | $297,000 | $93,488 | $203,512 |
| 2018 | $1,896 | $270,000 | $49,251 | $220,749 |
| 2016 | $1,742 | $127,930 | $27,159 | $100,771 |
| 2015 | $1,628 | $113,520 | $27,159 | $86,361 |
| 2014 | $1,695 | $120,844 | $27,159 | $93,685 |
| 2013 | -- | $103,885 | $22,798 | $81,087 |
Source: Public Records
Map
Nearby Homes
- 2353 Canyon View Dr
- 3232 N Redtail Way
- 1935 Deere Valley Dr
- 1821 E Whitetail Way
- 1827 E Whitetail Dr
- 2597 N 2300 E
- 1785 E 2825 N
- 1731 E 2825 N
- 2826 N 1600 E
- 2340 N 2050 E
- 3176 N 1450 E
- 3142 E Thorley Dr
- 2273 N 1975 E
- 1447 E 2700 N
- 2569 N 2900 E
- 2202 N 2300 E
- 2563 E 2250 N
- 2189 N 1950 E
- 1321 E 3125 N
- 3297 N Layton Ridge Dr
Your Personal Tour Guide
Ask me questions while you tour the home.