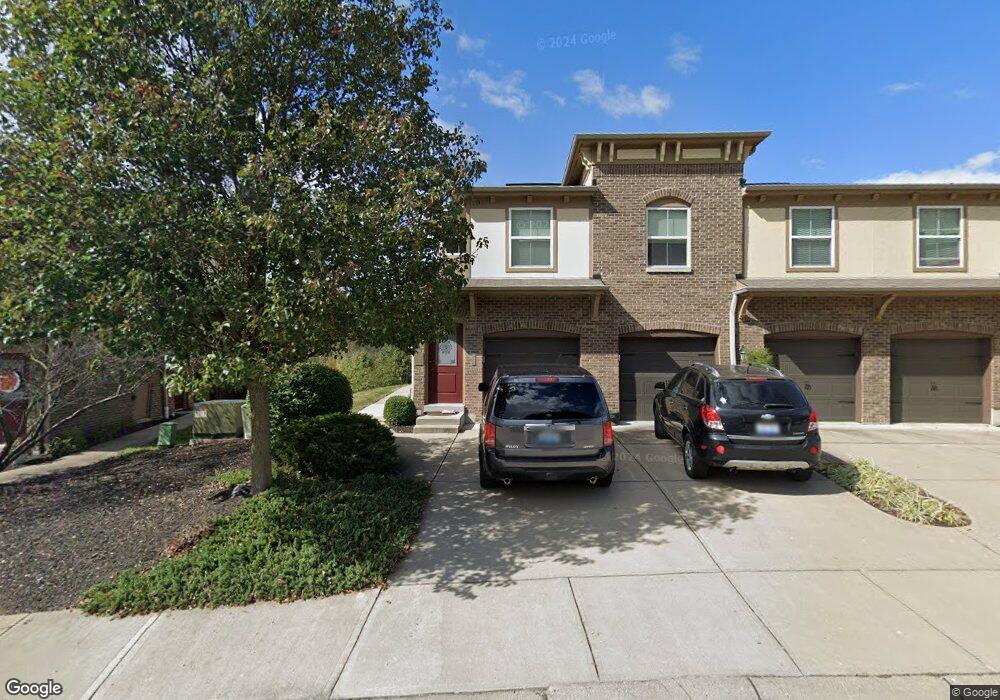
2161 Rolling Hills Dr Unit 16201 Fort Mitchell, KY 41017
South Covington NeighborhoodEstimated Value: $228,000 - $240,064
2
Beds
2
Baths
1,419
Sq Ft
$165/Sq Ft
Est. Value
About This Home
This home is located at 2161 Rolling Hills Dr Unit 16201, Fort Mitchell, KY 41017 and is currently estimated at $234,266, approximately $165 per square foot. 2161 Rolling Hills Dr Unit 16201 is a home located in Kenton County with nearby schools including Fort Wright Elementary School, Woodland Middle School, and Scott High School.
Ownership History
Date
Name
Owned For
Owner Type
Purchase Details
Closed on
Sep 27, 2024
Sold by
Gosney Nancy Rae and Aden Natalie Kay
Bought by
Mcdaniel Morgan Rae
Current Estimated Value
Home Financials for this Owner
Home Financials are based on the most recent Mortgage that was taken out on this home.
Original Mortgage
$182,400
Outstanding Balance
$180,533
Interest Rate
6.49%
Mortgage Type
New Conventional
Estimated Equity
$53,733
Purchase Details
Closed on
Jul 23, 2018
Sold by
Stephens Bret Jeffrey and Stephens Cara Michele
Bought by
Gosney Nancy Rae
Purchase Details
Closed on
Jun 1, 2012
Sold by
Fischer Attached Homes Ii L L C
Bought by
Randall Cara
Home Financials for this Owner
Home Financials are based on the most recent Mortgage that was taken out on this home.
Original Mortgage
$138,400
Interest Rate
3.88%
Mortgage Type
FHA
Create a Home Valuation Report for This Property
The Home Valuation Report is an in-depth analysis detailing your home's value as well as a comparison with similar homes in the area
Home Values in the Area
Average Home Value in this Area
Purchase History
| Date | Buyer | Sale Price | Title Company |
|---|---|---|---|
| Mcdaniel Morgan Rae | $228,000 | 360 American Title | |
| Mcdaniel Morgan Rae | $228,000 | 360 American Title | |
| Gosney Nancy Rae | $167,500 | Springdale Title Llc | |
| Randall Cara | $142,570 | Homestead Title Agency Ltd |
Source: Public Records
Mortgage History
| Date | Status | Borrower | Loan Amount |
|---|---|---|---|
| Open | Mcdaniel Morgan Rae | $182,400 | |
| Closed | Mcdaniel Morgan Rae | $182,400 | |
| Previous Owner | Randall Cara | $138,400 |
Source: Public Records
Tax History Compared to Growth
Tax History
| Year | Tax Paid | Tax Assessment Tax Assessment Total Assessment is a certain percentage of the fair market value that is determined by local assessors to be the total taxable value of land and additions on the property. | Land | Improvement |
|---|---|---|---|---|
| 2024 | $1,473 | $190,100 | $0 | $190,100 |
| 2023 | $1,532 | $190,100 | $0 | $190,100 |
| 2022 | $1,676 | $190,100 | $0 | $190,100 |
| 2021 | $1,463 | $167,500 | $0 | $167,500 |
| 2020 | $1,492 | $167,500 | $0 | $167,500 |
| 2019 | $1,932 | $167,500 | $0 | $167,500 |
| 2018 | $1,659 | $142,500 | $0 | $142,500 |
| 2017 | $1,614 | $142,500 | $0 | $142,500 |
| 2015 | $2,003 | $142,500 | $0 | $142,500 |
| 2014 | $1,965 | $142,500 | $0 | $142,500 |
Source: Public Records
Map
Nearby Homes
- 2489 Rolling Hills Dr
- 1978 Williamscreek Way
- 1976 Williamscreek Way
- 2426 Arezzo St
- 2457 Cetona Way
- 2432 Cetona Way
- 2461 Cetona Way
- 2459 Cetona Way
- 2442 Cetona Way
- 2476 Cetona Way
- 2444 Cetona Way Unit 409-202
- 2432 Cetona Way Unit 409-101
- 2470 Cetona Way
- 2461 Cetona Way Unit 408-202
- 2459 Cetona Way Unit 408-203
- 2457 Cetona Way Unit 408-303
- 2470 Cetona Way Unit 407-303
- 2476 Cetona Way Unit 407-104
- 3921 Volterra Ln
- 3921 Volterra Ln Unit 299A
- 2157 Rolling Hills Dr
- 2157 Rolling Hills Dr Unit 16301
- 2159 Rolling Hills Dr
- 2159 Rolling Hills Dr Unit 16101
- 2161 Rolling Hills Dr
- 2155 Rolling Hills Dr
- 2155 Rolling Hills Dr Unit 16300
- 2169 Rolling Hills Dr
- 2169 Rolling Hills Dr Unit 15104
- 2171 Rolling Hills Dr
- 2171 Rolling Hills Dr Unit 15304
- 2175 Rolling Hills Dr
- 2175 Rolling Hills Dr Unit 15305
- 2151 Rolling Hills Dr
- 2151 Rolling Hills Dr Unit 16102
- 2153 Rolling Hills Dr
- 2149 Rolling Hills Dr
- 2149 Rolling Hills Dr Unit 16202
- 2133 Rolling Hills Dr
- 2147 Rolling Hills Dr