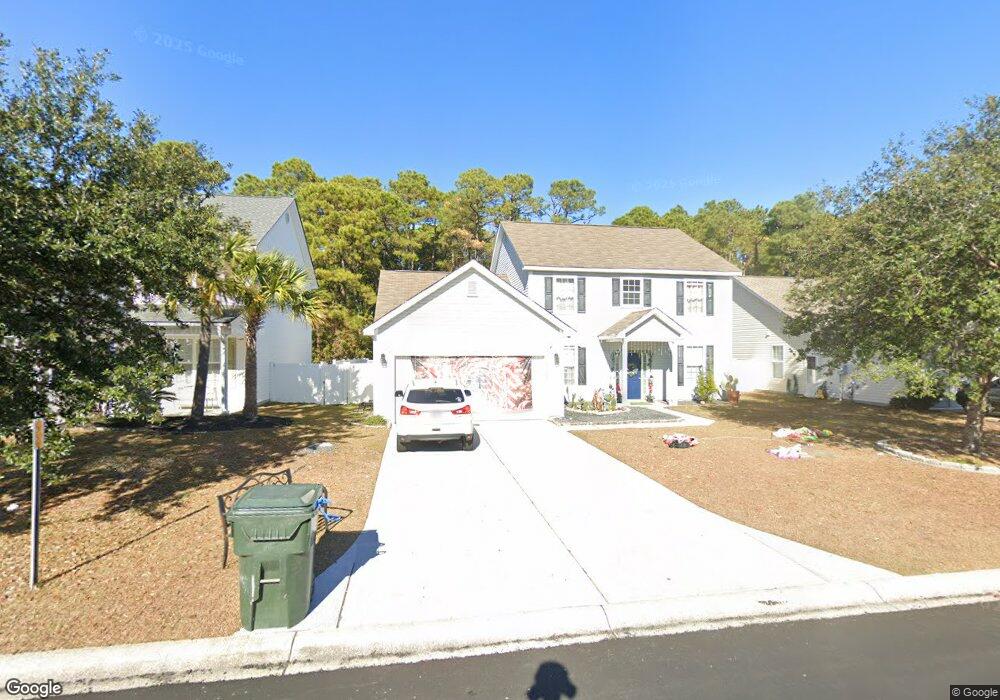
2162 Seneca Ridge Dr Unit Park Point @ Avalon Myrtle Beach, SC 29579
Estimated Value: $341,000 - $385,000
4
Beds
3
Baths
2,220
Sq Ft
$165/Sq Ft
Est. Value
About This Home
This home is located at 2162 Seneca Ridge Dr Unit Park Point @ Avalon, Myrtle Beach, SC 29579 and is currently estimated at $366,493, approximately $165 per square foot. 2162 Seneca Ridge Dr Unit Park Point @ Avalon is a home located in Horry County with nearby schools including Carolina Forest Elementary School, Ten Oaks Middle, and Carolina Forest High School.
Ownership History
Date
Name
Owned For
Owner Type
Purchase Details
Closed on
Mar 21, 2022
Sold by
Vanmcintyre Bich Van
Bought by
Miskin Yehoshua
Current Estimated Value
Home Financials for this Owner
Home Financials are based on the most recent Mortgage that was taken out on this home.
Original Mortgage
$344,375
Outstanding Balance
$320,387
Interest Rate
3.55%
Mortgage Type
New Conventional
Estimated Equity
$46,106
Purchase Details
Closed on
Jun 3, 2015
Sold by
Andrews David M
Bought by
Vanmcintyre Bich
Home Financials for this Owner
Home Financials are based on the most recent Mortgage that was taken out on this home.
Original Mortgage
$156,750
Interest Rate
3.88%
Mortgage Type
Future Advance Clause Open End Mortgage
Purchase Details
Closed on
May 16, 2012
Sold by
Lanman Norman
Bought by
Andrews David M
Purchase Details
Closed on
Mar 31, 2005
Sold by
Beazer Homes Corp
Bought by
Lanman Joseph T
Create a Home Valuation Report for This Property
The Home Valuation Report is an in-depth analysis detailing your home's value as well as a comparison with similar homes in the area
Home Values in the Area
Average Home Value in this Area
Purchase History
| Date | Buyer | Sale Price | Title Company |
|---|---|---|---|
| Miskin Yehoshua | $362,500 | -- | |
| Vanmcintyre Bich | $209,000 | -- | |
| Andrews David M | $180,000 | -- | |
| Lanman Joseph T | $210,453 | -- |
Source: Public Records
Mortgage History
| Date | Status | Borrower | Loan Amount |
|---|---|---|---|
| Open | Miskin Yehoshua | $344,375 | |
| Previous Owner | Vanmcintyre Bich | $156,750 |
Source: Public Records
Tax History Compared to Growth
Tax History
| Year | Tax Paid | Tax Assessment Tax Assessment Total Assessment is a certain percentage of the fair market value that is determined by local assessors to be the total taxable value of land and additions on the property. | Land | Improvement |
|---|---|---|---|---|
| 2024 | $1,380 | $14,042 | $4,556 | $9,486 |
| 2023 | $1,380 | $14,335 | $3,802 | $10,533 |
| 2021 | $3,140 | $10,490 | $2,666 | $7,824 |
| 2020 | $2,986 | $10,490 | $2,666 | $7,824 |
| 2019 | $2,986 | $10,490 | $2,666 | $7,824 |
| 2018 | $2,697 | $8,310 | $2,202 | $6,108 |
| 2017 | $2,682 | $8,310 | $2,202 | $6,108 |
| 2016 | -- | $8,310 | $2,202 | $6,108 |
| 2015 | $771 | $8,310 | $2,202 | $6,108 |
| 2014 | $712 | $8,310 | $2,202 | $6,108 |
Source: Public Records
Map
Nearby Homes
- 2356 Seneca Ridge Dr
- 2352 Seneca Ridge Dr
- 872 Silvercrest Dr
- 813 Silvercrest Dr
- 394 Thistle Ln
- 2412 Whetstone Ln
- 1009 Stoney Falls Blvd
- 454 Dandelion Ln
- 715 Pepperbush Dr
- 2005 Silvercrest Dr Unit G-32
- 2005 Silvercrest Dr Unit 32B
- 425 Dandelion Ln
- 4071 Dewberry Ln Unit Lot 966
- 3270 Moss Bridge Ln Unit Lot 955
- 3391 Moss Bridge Ln
- 3323 Moss Bridge Ln
- 2013 Silvercrest Dr Unit 30H
- 2013 Silvercrest Dr Unit 30F
- 413 Dandelion Ln
- 2033 Silvercrest Dr Unit 21B
- 2162 Seneca Ridge Dr Unit Park Pointe @ Avalon
- 2162 Seneca Ridge Dr
- 2158 Seneca Ridge Dr Unit Park Pointe @ Avalon
- 2158 Seneca Ridge Dr
- 2166 Seneca Ridge Dr
- 2170 Seneca Ridge Dr
- 2154 Seneca Ridge Dr
- 2174 Seneca Ridge Dr
- 2150 Seneca Ridge Dr Unit Avalon
- 2150 Seneca Ridge Dr Unit Avalon-Carolina Fore
- 2150 Seneca Ridge Dr
- 2167 Seneca Ridge Dr
- 2163 Seneca Ridge Dr
- 2159 Seneca Ridge Dr
- 2171 Seneca Ridge Dr
- 2155 Seneca Ridge Dr
- 2146 Seneca Ridge Dr
- 2178 Seneca Ridge Dr
- 2151 Seneca Ridge Dr
- 2175 Seneca Ridge Dr