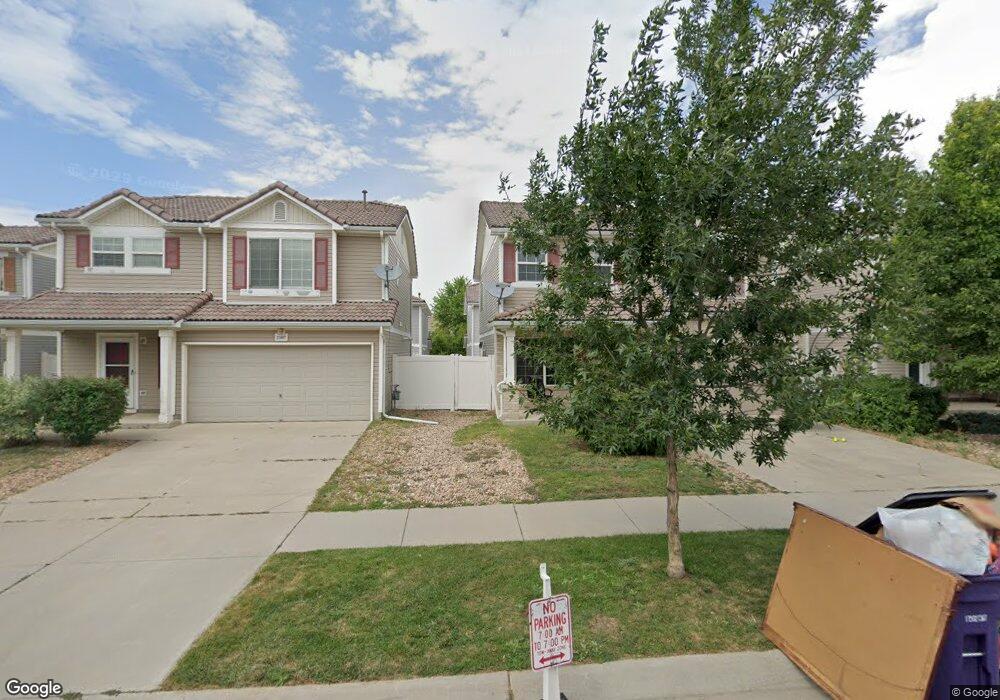
21627 E 55th Place Denver, CO 80249
Green Valley Ranch NeighborhoodEstimated Value: $289,000 - $427,564
3
Beds
3
Baths
1,754
Sq Ft
$213/Sq Ft
Est. Value
About This Home
This home is located at 21627 E 55th Place, Denver, CO 80249 and is currently estimated at $374,391, approximately $213 per square foot. 21627 E 55th Place is a home located in Denver County with nearby schools including Pitt-Waller K-8 School, McGlone Academy, and Marie L. Greenwood Academy.
Ownership History
Date
Name
Owned For
Owner Type
Purchase Details
Closed on
Jan 24, 2020
Sold by
2018 1H Borrower Lp
Bought by
Rutter Mary Beth
Current Estimated Value
Home Financials for this Owner
Home Financials are based on the most recent Mortgage that was taken out on this home.
Original Mortgage
$8,722
Outstanding Balance
$7,672
Interest Rate
3.7%
Mortgage Type
FHA
Estimated Equity
$366,719
Purchase Details
Closed on
Jun 11, 2015
Sold by
Colfin Ai-Co 1 Llc
Bought by
Cah 2015-1 Borrower Llc
Purchase Details
Closed on
Mar 3, 2014
Sold by
Medina Bruce
Bought by
Colfin Ai Co 1 Llc
Purchase Details
Closed on
Sep 3, 2004
Sold by
Oakwood Homes Llc
Bought by
Medina Richard R
Home Financials for this Owner
Home Financials are based on the most recent Mortgage that was taken out on this home.
Original Mortgage
$154,307
Interest Rate
5.74%
Mortgage Type
VA
Create a Home Valuation Report for This Property
The Home Valuation Report is an in-depth analysis detailing your home's value as well as a comparison with similar homes in the area
Home Values in the Area
Average Home Value in this Area
Purchase History
| Date | Buyer | Sale Price | Title Company |
|---|---|---|---|
| Rutter Mary Beth | $222,093 | First American Title | |
| Cah 2015-1 Borrower Llc | -- | None Available | |
| Colfin Ai Co 1 Llc | $176,000 | None Available | |
| Medina Richard R | $159,000 | Town & Country Title Service |
Source: Public Records
Mortgage History
| Date | Status | Borrower | Loan Amount |
|---|---|---|---|
| Open | Rutter Mary Beth | $8,722 | |
| Previous Owner | Medina Richard R | $154,307 |
Source: Public Records
Tax History
| Year | Tax Paid | Tax Assessment Tax Assessment Total Assessment is a certain percentage of the fair market value that is determined by local assessors to be the total taxable value of land and additions on the property. | Land | Improvement |
|---|---|---|---|---|
| 2025 | $1,676 | $33,100 | $2,810 | $2,810 |
| 2024 | $1,676 | $13,100 | $2,670 | $10,430 |
| 2023 | $1,613 | $13,100 | $2,670 | $10,430 |
| 2022 | $2,110 | $15,850 | $2,400 | $13,450 |
| 2021 | $1,949 | $16,310 | $2,470 | $13,840 |
| 2020 | $2,038 | $15,380 | $2,470 | $12,910 |
| 2019 | $2,006 | $15,380 | $2,470 | $12,910 |
| 2018 | $2,475 | $18,280 | $1,530 | $16,750 |
| 2017 | $3,071 | $18,280 | $1,530 | $16,750 |
| 2016 | $2,823 | $17,050 | $1,481 | $15,569 |
| 2015 | $2,764 | $17,050 | $1,481 | $15,569 |
| 2014 | $1,663 | $10,520 | $2,388 | $8,132 |
Source: Public Records
Map
Nearby Homes
- 21599 Randolph Place
- 21488 Randolph Place
- 5445 Perth Ct
- 21417 E 55th Place
- 5384 Perth Ct
- 21350 E 58th Ave
- 5804 N Perth St
- 5559 Malta St
- 5826 N Orleans St
- 21646 E 59th Place
- 5188 Netherland St
- 21463 E 59th Place
- 21584 E 59th Dr
- 21554 E 59th Dr
- 5520 Liverpool St
- 21815 E 51st Dr
- 21875 E 51st Dr
- 5181 N Quatar St
- 5185 Netherland St
- 21927 E 51st Dr
- 21627 55th Place
- 21607 55th Place
- 21607 E 55th Place
- 21637 55th Place
- 21628 Randolph Place
- 21608 Randolph Place
- 21638 Randolph Place
- 21597 55th Place
- 21647 55th Place
- 21597 E 55th Place
- 21598 Randolph Place
- 21648 Randolph Place
- 21567 55th Place
- 21568 Randolph Place
- 21626 55th Place
- 21626 E 55th Place
- 5565 Perth Ct
- 21606 55th Place
- 21616 55th Place
- 21606 E 55th Place
Your Personal Tour Guide
Ask me questions while you tour the home.